Twin Cities home buyer activity is recovering amid safe REALTOR® practices
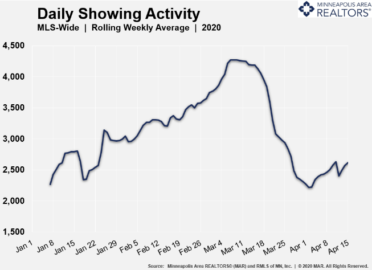
(April 17, 2020) – According to new data from the Minneapolis Area REALTORS® and the Saint Paul Area Association of REALTORS®, the number of Twin Cities residential real estate showings displayed the first signs of a turnaround since they began declining during the onset of the coronavirus in mid-March.Since reaching their valley around April 2, showings have been on the rise. As of April 10, overall showings were up 16.1 percent compared to a week earlier. Reduced activity during the Easter and Passover holidays eroded that gain slightly, but that is likely a temporary blip.
 “Despite some concerns among buyers and sellers, there’s clearly still activity occurring,” said Linda Rogers, President of Minneapolis Area REALTORS®. “It is still vital that REALTORS® continue to follow best practices for showing homes safely and to consider other options such as virtual tours.”
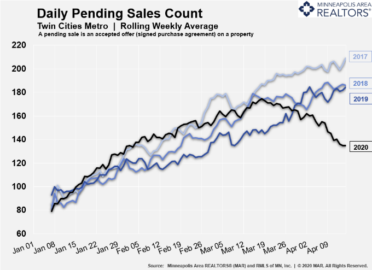
Both new listings and pending sales also saw declines in the second half of March and into April. New listings began to decline around March 26 and are now roughly 36.8 percent below their 2020 peak. The decline in buyer activity was earlier but not as severe. Pending sales began to decline around March 18 and are now about 19.1 percent below their peak.

“March was off to a strong start until the middle of the month when everything changed,” said Patrick Ruble, President of St. Paul Area Association of REALTORS®. “We even saw a double-digit gain in new listings, providing more options for buyers facing limited choices. The strength of the market preceding this crisis bodes well for a relatively quick recovery once this crisis is over.”
The monthly report for March, with its 16.0 percent gain in new listings and 11.2 percent increase in pending and closed sales, paints only a partial picture of COVID-19’s impact on the market. The numbers don’t fully reflect the effect of the stay-at-home order and school closures which occurred in the second half of the month. And most March sales were for purchase agreements that were finalized in January and February. The April numbers will offer a far more accurate view of COVID-19’s impact on the Twin Cities housing market – from sales, listings and inventory to market times and home prices.
For March, the median Twin Cities home price was up 8.0 percent to $297,000. Mortgage rates on a 30-year fixed loan are now around 3.4 percent—just about the lowest they’ve ever been. While recessions can pause market activity, they typically have only a minor impact on home prices. The undersupplied market—especially at the affordable end—should also shield prices.
March 2020 by the numbers compared to a year ago
- Sellers listed 7,220 properties on the market, a 16.0 percent increase from last March
- Buyers signed 5,148 purchase agreements, up 11.2 percent (4,155 closed sales, also up 11.2 percent)
- Inventory levels declined 11.3 percent to 8,597 units
- Months Supply of Inventory was down 15.0 percent to7 months (5-6 months is balanced)
- The Median Sales Price rose 8.0 percent to $297,000
- Cumulative Days on Market decreased 9.1 percent to 60 days, on average (median of 26)
- Changes in Sales activity varied by market segment
- Single family sales rose 13.5 percent; condo sales were up 8.4 percent; townhome sales increased 8.1 percent
- Traditional sales increased 13.6 percent; foreclosure sales dropped 34.6 percent; short sales fell 9.5 percent
- Previously owned sales were up 13.5 percent; new construction sales climbed 5.9 percent
For more information on weekly and monthly housing numbers visit www.mplsrealtor.com.
From The Skinny Blog.


