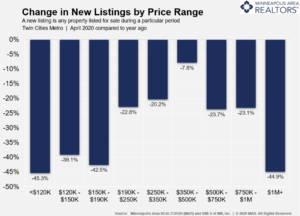
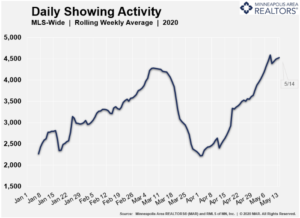
(May 21, 2020) – According to new data from the Minneapolis Area REALTORS® and the Saint Paul Area Association of REALTORS®, both buyer and seller activity was down in April, but the number of residential showings has reached a new high for the year.Both new listings and pending purchase activity was down in April compared to a year ago, but the declines varied dramatically by price range. For homes priced between $350,000 and $500,000, for example, sellers listed just 7.8 percent fewer homes than last April. Homes priced over $1,000,000, however, saw a 44.9 percent decrease in new listings. New listings at the far-affordable end of the market also saw notable declines.

“March started off strong and that strength returned later in April and into May; however, the latter half of March and the start of April saw set-backs due to COVID-19,” said Patrick Ruble, President of the Saint Paul Area Association of REALTORS®. “REALTORS® are busy, and we’ve seen gains for both buyers and sellers in late-April and May.”
The price gains in April may surprise some. In fact, April was the first month on record where the median home price surpassed $300,000. Home prices and closed sales both rose in April, reflecting purchase agreements signed in February and the first half of March. Homes actually sold more quickly this April than last, as health concerns held back some less serious buyers but motivated buyers who remained active and committed.
“We expected much of the pull-back resulting from COVID-19 would show up in April, so the shift isn’t that surprising,” said Linda Rogers, President of the Minneapolis Area REALTORS®. “But showings are a leading indicator for purchase activity and they’ve reached new highs for the year. We expect this to translate into stronger sales activity once the health situation stabilizes.”

The recent job losses have impacted some market segments more than others. Buyers in the affordable brackets are more likely to be impacted by job losses in the leisure, hospitality or retail space, while those looking in the luxury brackets may be impacted by volatility in equity markets. The middle-market ranges performed the best, perhaps propped up by salaried professionals who can work from home.
For April, the median Twin Cities home price was up 8.9 percent to $305,000, a new high for the metro area. Mortgage rates on a 30-year fixed loan are around 3.4 percent—just about the lowest they have ever been. While recessions can pause market activity, they typically only have a minor impact on home prices. The undersupplied market—especially at the affordable end—should also prevent any price softening.
April 2020 by the numbers compared to a year ago
- Sellers listed 5,967 properties on the market, a 22.9 percent decrease from last April
- Buyers signed 4,612 purchase agreements, down 20.1 percent (4,609 closed sales, up 3.5 percent)
- Inventory levels declined 13.1 percent to 9,279 units
- Months Supply of Inventory was down 18.2 percent to8 months (5-6 months is balanced)
- The Median Sales Price rose 8.9 percent to $305,000 (over $300,000 for the first time ever)
- Cumulative Days on Market decreased 17.5 percent to 47 days, on average (median of 17)
- Changes in Sales activity varied by market segment
- Single family sales rose 11.1 percent; condo sales were down 33.2 percent; townhome sales declined 5.3 percent
- Traditional sales increased 5.0 percent; foreclosure sales dropped 33.7 percent; short sales fell 43.5 percent
- Previously owned sales were up 4.9 percent; new construction sales climbed 4.7 percent
