Increased seller activity is critical to replenishing inventories. New listings rose 10.2 percent to 7,776 newly listed homes, a welcome sign for prospective buyers. Inventory levels are still constrained, but consumers should have more options to choose from this year than last year.
With higher prices and more buyers on the prowl, more sellers are able to go the traditional route. Traditional new listings rose 25.7 percent compared to last year at this time, while foreclosure and short sale new listings fell 41.6 percent and 49.6 percent, respectively.
On the demand side, pending sales declined 3.9 percent to 5,127 properties overall, once again reflecting less distressed market activity. Traditional pending sales were up 8.2 percent while pending foreclosure and short sales fell 40.4 and 35.1 percent, respectively. The inventory of homes for sale in the Twin Cities is now at 14,429 properties, 1.5 percent more than last year at this time, marking the first year-over-year increase since October 2013 and the largest increase since January 2011.
“We’re seeing the return of a real estate market led by traditional listings and sales,” said Emily Green, President of the Minneapolis Area Association of REALTORS® (MAAR). “Coupled with more inventory – attractive inventory – it’s setting up to be an exciting year for buyers and sellers.”
As a result of the ongoing shift in the types of homes being sold, the median sales price for the metro rose 8.0 percent to $197,000. That’s 26 straight months of year-over-year price gains. Foreclosures and short sales now make up just 11.4 percent of all new listings. Last April, they made up 22.4 percent. For closed sales, the number fell from 31.3 to 20.9 percent.
On average, homes spent 89 days on the market, down 8.2 percent from last April. Sellers are receiving an average of 95.9 percent of their original list price. The Twin Cities now has 3.4 months’ supply of inventory, the same mark that it was last April.
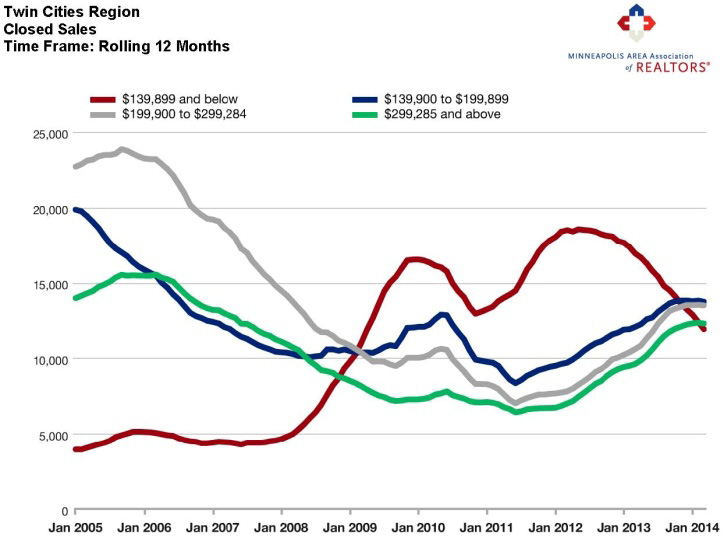
“Distressed inventory has made up the majority of the lower price ranges, and that market is evaporating,” said Mike Hoffman, MAAR President-Elect. “We can anticipate more negotiations and transactions with people rather than banks.”
All information is according to the Minneapolis Area Association of REALTORS® (MAAR) based on data from NorthstarMLS. MAAR is the leading regional advocate and provider of information services and research on the real estate industry for brokers, real estate professionals and the public. MAAR serves the Twin Cities 13-county metro area and western Wisconsin. 10K Research and Marketing, LLC is a wholly owned subsidiary of MAAR.

