Tuesday, October 14th, 2014

Every story needs a hero, and housing’s current starlet is (drum roll, please) inventory. More markets continue to see increases in homes for sale, giving buyers more options and keeping prices from trying to overshadow the popularity of inventory with unsustainable stardom. As autumnal extracurriculars pick up and department store decorations trend towards the mustard palate, sales may drop off some, but the subplots of normalization and stabilization should remain popular with year-over-year inventory increases in the leading role.

In the Twin Cities region, for the week ending October 4:

  • New Listings decreased 3.8% to 1,477
  • Pending Sales increased 1.7% to 1,063
  • Inventory increased 10.9% to 18,696

For the month of September:

  • Median Sales Price increased 5.1% to $205,000
  • Days on Market remained flat at 71
  • Percent of Original List Price Received decreased 0.9% to 95.6%
  • Months Supply of Inventory increased 15.8% to 4.4

All comparisons are to 2013

Click here for the full Weekly Market Activity Report. From The Skinny Blog.

Posted in Weekly Report |
Monday, October 13th, 2014
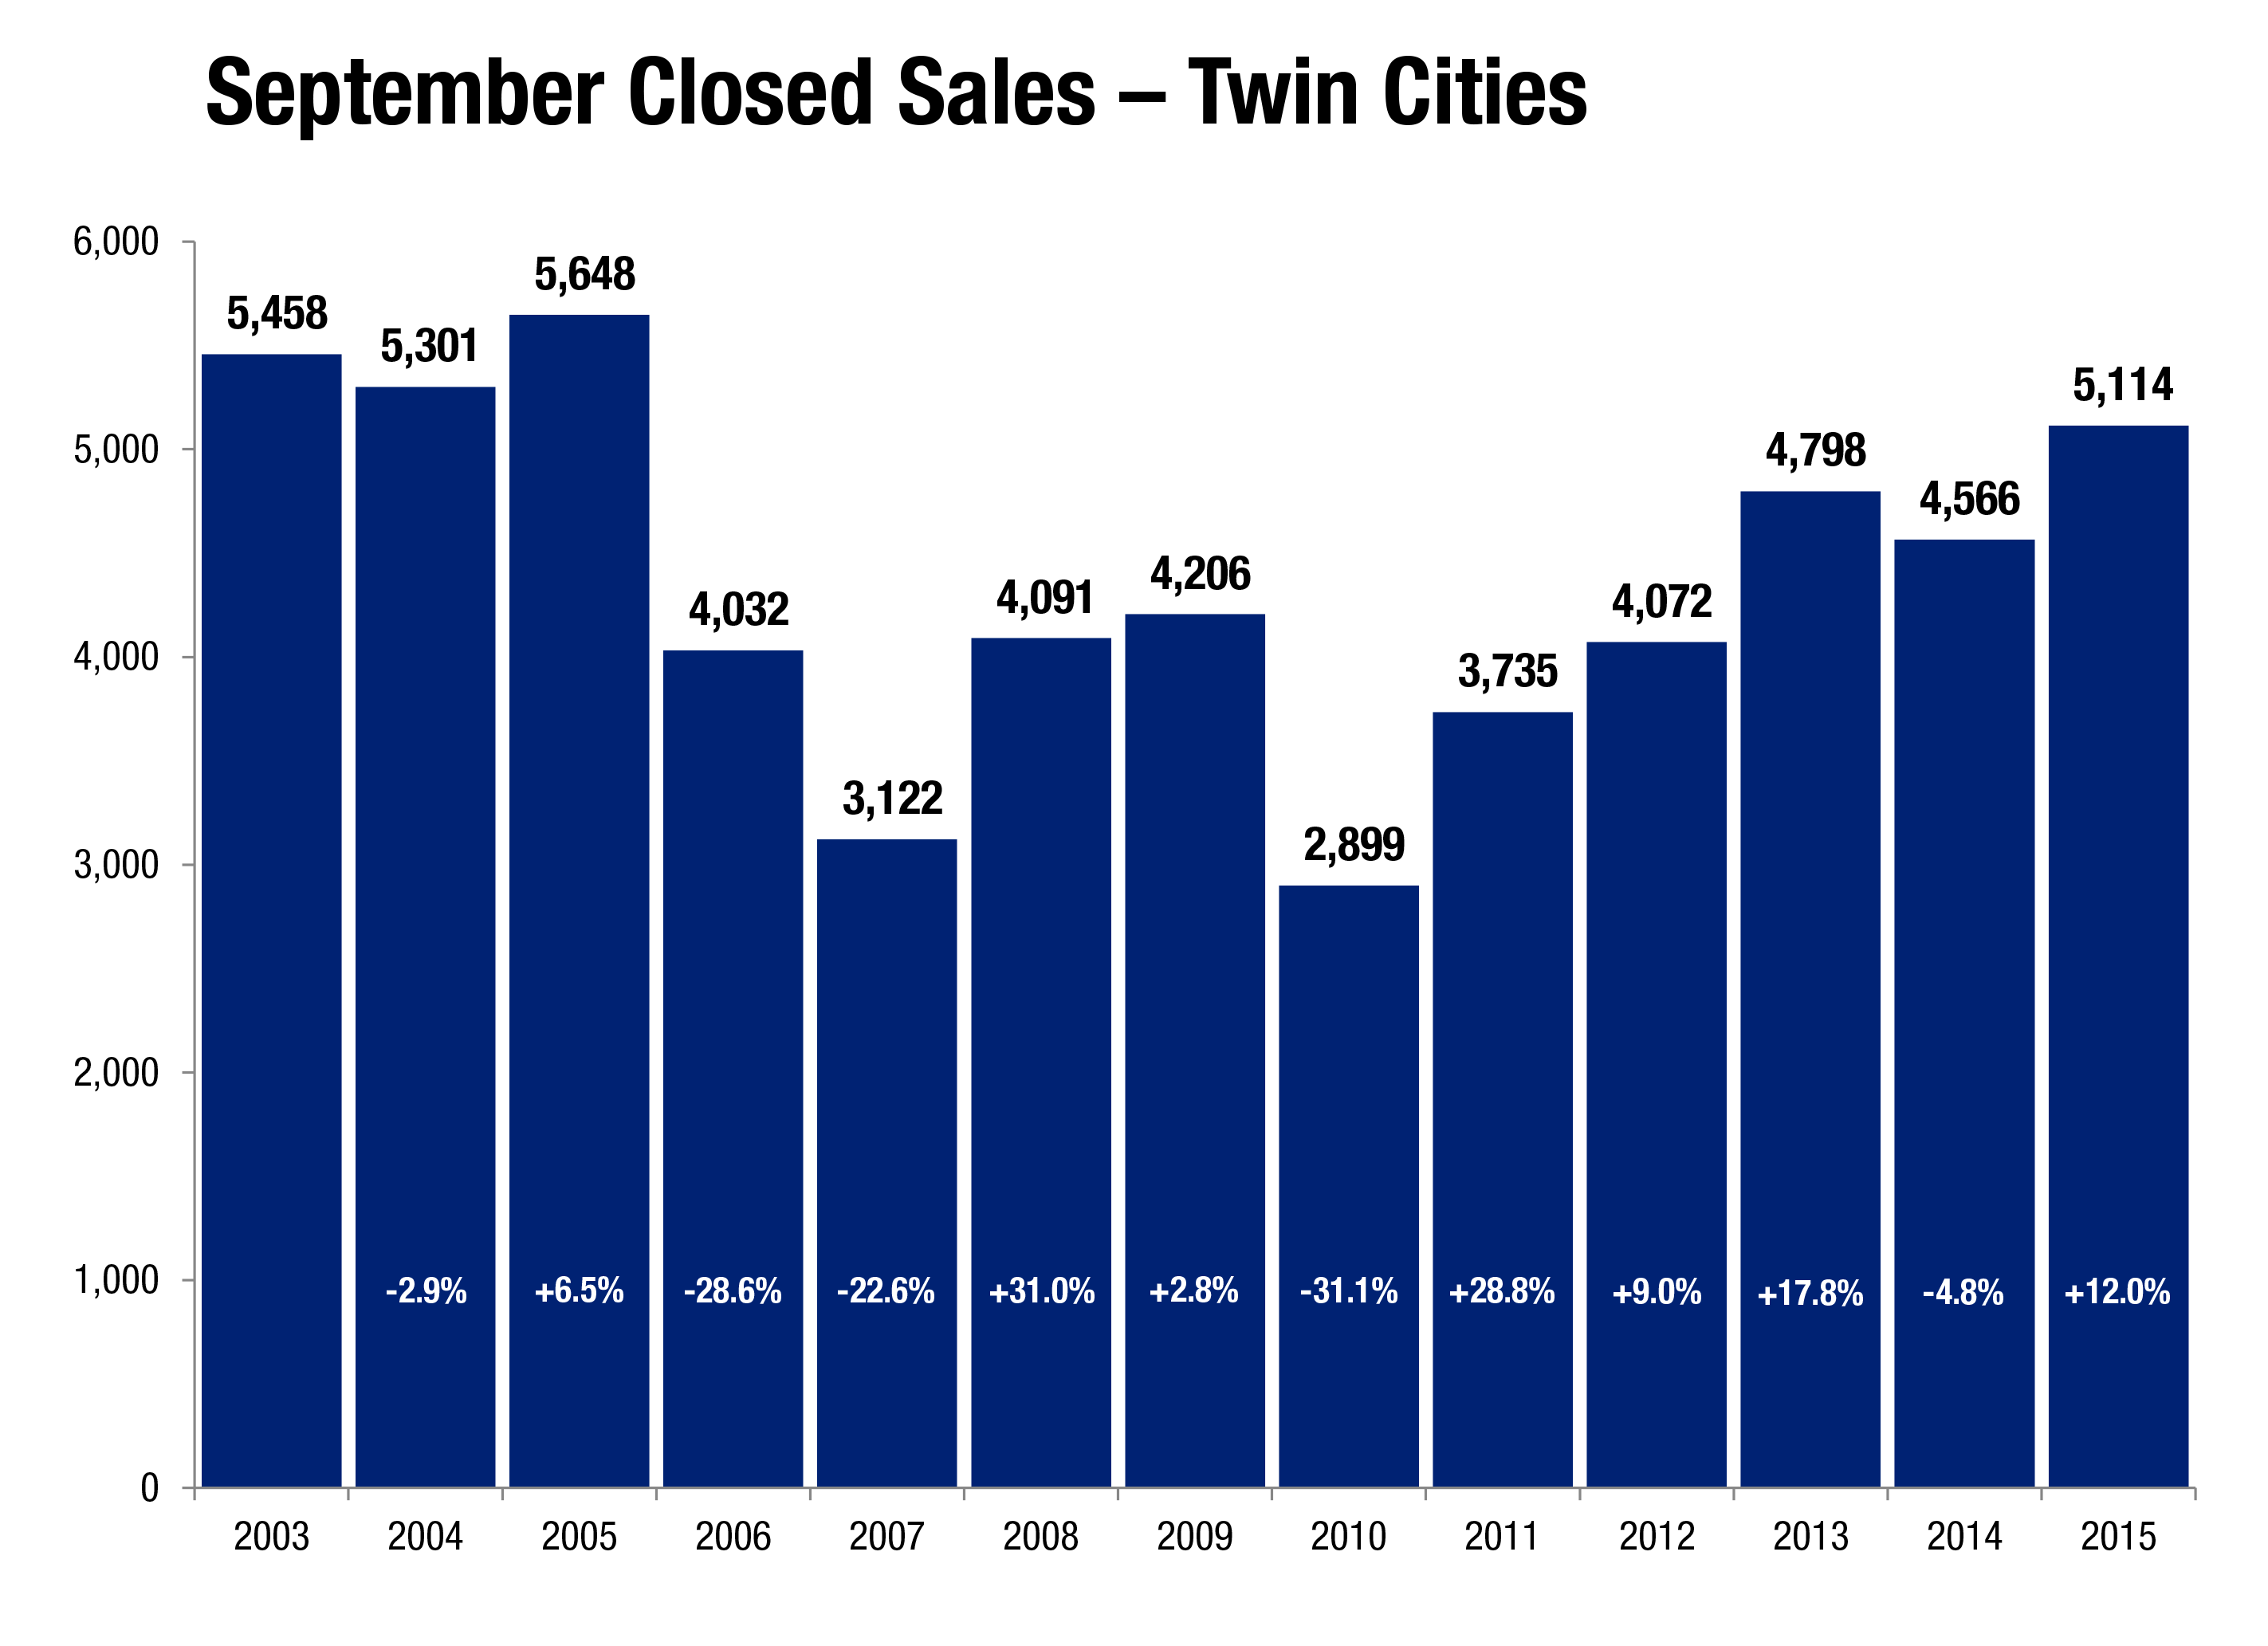
For the month of September 2014, inventory in the 13-county Minneapolis–St. Paul metropolitan area rose 8.2 percent from last year, and it was the seventh month in a row of year-over-year inventory gains. Consumers now have 18,250 homes from which to choose. Sellers were more motivated to sell this year, as evidenced by new listing activity increasing 7.2 percent to 6,832. Top-line pending sales decreased a slight 1.3 percent to 4,155, indicative of there being less foreclosure activity entering the market than anything else.

With 4.4 months’ supply of inventory, the absorption rate is consistent with a market transitioning back toward balanced territory, where neither buyers nor sellers have a clear edge. The sales mix continued to skew toward traditional homes that sell in less time and at higher price points. The median sales price rose 5.1 percent to $205,000. That now marks 31 consecutive months of year-over-year price gains.

Prices are driven by several factors such as supply and demand but also changes in the sales mix. Looking more deeply at the numbers, a story emerges. While new listings rose 7.2 percent overall, traditional new listings were up 17.9 percent while foreclosure and short sale new listings fell 42.2 and 42.5 percent, respectively. Similarly, overall pending sales were down 1.3 percent, but traditional pending sales rose 9.2 percent while foreclosure and short sale pendings fell 37.0 and 43.3 percent. Market-wide inventory levels increased 8.2 percent, but traditional inventory was up 23.2 percent while foreclosure and short sale inventory levels fell 38.2 and 47.1 percent.

Despite nearly three straight years of rising prices, the Twin Cities housing affordability index has remained relatively stable. The current reading of 186 indicates that the median household income was 86 percent greater than what’s necessary to qualify for the median-priced home under current interest rates. While the index is below its 2012 peak, it remains above its long-term average.

Buyers have more homes from which to choose than they had at any point in 2013 and half of 2012. A growing share of that inventory falls into the traditional segment. Days on market was perfectly even with last year at 71 days. The median list price rose 6.7 percent to $239,900. Price per square foot rose 4.7 percent to $121.

According to the Bureau of Labor Statistics, the Twin Cities currently has the lowest unemployment rate among major metros in the nation at 3.8 percent. The national rate dropped below 6.0 percent for the first time since 2008.

Posted in The Skinny |
Monday, October 6th, 2014

With the exciting sales pace of summer behind us, and focus now shifting inward toward family, school and other interests for many Americans, the numbers will start to dip in most markets. Seasonal shifts can be a drag, but it can also mean opportunity. Bargain hunters, first-time buyers, empty nesters, investors and younger buyers with no school-aged children are among the crowd that are not necessarily framed by the summer months. New construction is inching upwards, and the national unemployment rate dropped below 6.0 to 5.9 for the first time since 2008, so there’s still plenty of rosy attitude in a balanced market.

In the Twin Cities region, for the week ending September 27:

  • New Listings decreased 1.3% to 1,431
  • Pending Sales decreased 14.5% to 945
  • Inventory increased 10.0% to 18,753

For the month of August:

  • Median Sales Price increased 5.3% to $219,000
  • Days on Market decreased 2.9% to 68
  • Percent of Original List Price Received decreased 0.7% to 96.3%
  • Months Supply of Inventory increased 18.4% to 4.5

All comparisons are to 2013

Click here for the full Weekly Market Activity Report. From The Skinny Blog.

Posted in Weekly Report |
Monday, September 29th, 2014

The season of crisp leaves, autumn colors and, yes, pumpkin spice lattes is upon us. Just in time for the fall equinox, mortgage applications have risen according to the Mortgage Bankers Association. Though the season will likely slow things considerably in some areas, it seems that buyers are not quite ready to succumb to the cinnamon haze that is fall just yet.

In the Twin Cities region, for the week ending September 20:

  • New Listings increased 10.3% to 1,621
  • Pending Sales decreased 5.0% to 930
  • Inventory increased 9.4% to 18,644

For the month of August:

  • Median Sales Price increased 5.3% to $219,000
  • Days on Market decreased 2.9% to 68
  • Percent of Original List Price Received decreased 0.7% to 96.3%
  • Months Supply of Inventory increased 18.4% to 4.5

All comparisons are to 2013

Click here for the full Weekly Market Activity Report. From The Skinny Blog.

Posted in Weekly Report |
Monday, September 22nd, 2014

As September deepens, a certain level of seasonal housing market cooling is bound to occur, but year-over-year trends do not seem poised to offend. Overheated and undercooked markets might make pretty for media outlets, yet a balanced market is the best friend of the buyer, the seller and, frankly, the real estate practitioner. Seasonal dips are nothing to fret over. It is now and will continue to be best to measure residential real estate activity not by months but by years.

In the Twin Cities region, for the week ending September 13:

  • New Listings increased 1.6% to 1,650
  • Pending Sales decreased 1.0% to 993
  • Inventory increased 9.5% to 18,513

For the month of August:

  • Median Sales Price increased 5.3% to $219,000
  • Days on Market decreased 2.9% to 68
  • Percent of Original List Price Received decreased 0.7% to 96.3%
  • Months Supply of Inventory increased 15.8% to 4.4

All comparisons are to 2013

Click here for the full Weekly Market Activity Report. From The Skinny Blog.

Posted in Weekly Report |