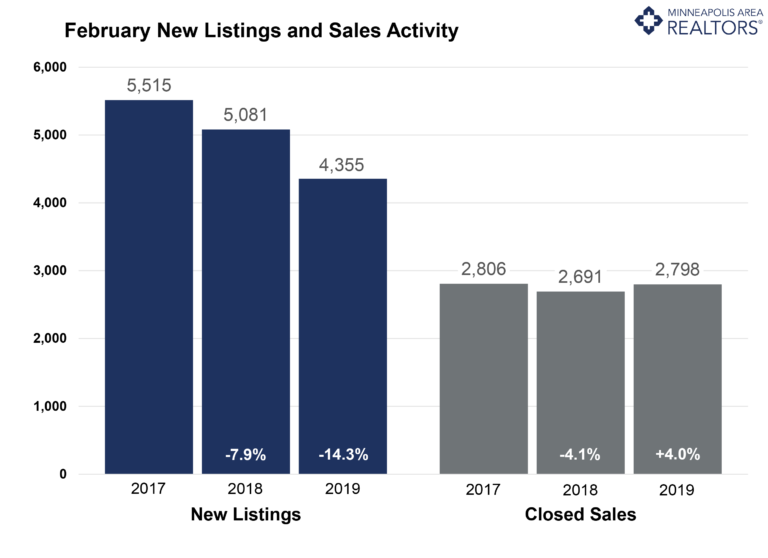
Winter sports enthusiasts likely enjoyed the snowiest February on record more than those attempting to buy and sell homes. Even so, the latest numbers for Twin Cities residential real estate show some strength amidst ongoing signs of change. Sellers showed a sizeable, weather-related decline in listing activity, while buyers entered into fewer contracts than last February even while closed sales rose. Market times flattened out as the median sales price continued to rise compared to last year. One sign of a changing market is the fact that the ratio of sold to list price has fallen for three of the last four months. This—along with other indicators—suggest the market is improving for buyers, even though sellers still have strong pricing, favorable negotiating leverage and quick market times.
Due to the decline in new listings, the number of active listings for sale decreased compared to the prior year. Even so, buyers have seen inventory gains for four of the last five months. Months supply followed suit, tick down to 1.6 months, suggesting the market is still tight. Buyers should expect competition on the most sought-after listings and neighborhoods. After increasing to 5.0 percent in November, mortgage rates have settled back down around 4.5 percent. That’s great news for buyers. The supply squeeze is most evident at the entry-level prices, where multiple offers and homes selling for over list price are commonplace. The move-up and upper-bracket segments are less competitive and better supplied. Inventory could rise substantially, and we’d still have a balanced market.

February 2019 by the Numbers (compared to a year ago)
Sellers listed 4,355 properties on the market, a 14.3 percent decrease from last February
Buyers closed on 2,798 homes, a 4.0 percent increase
Inventory levels for February declined 5.7 percent compared to 2018 to 7,936 units
Months Supply of Inventory decreased 5.9 percent to 1.6 months
The Median Sales Price rose 6.2 percent to $265,500, a record high for February
Cumulative Days on Market was flat at 69 days, on average (median of 43)
Changes in Sales activity varied by market segment
Single family sales rose 6.7 percent; condo sales fell 0.9 percent; townhome sales increased 1.0 percent
Traditional sales increased 7.4 percent; foreclosure sales sank 40.3 percent; short sales fell 41.4 percent
Previously-owned sales were up 4.7 percent; new construction sales rose 5.3 percent
Quotables
“The cold and snow in February was certainly an impediment,” said Todd Urbanski, President of Minneapolis Area REALTORS®. “The March numbers will offer more clarity on market direction.”
“We’re still sensing plenty of interest from buyers and sellers,” said Linda Rogers, President-Elect of Minneapolis Area REALTORS®. “This spring market should be productive, especially with more inventory.”
All information is according to the Minneapolis Area REALTORS® based on data from NorthstarMLS. Minneapolis Area REALTORS® is the leading regional advocate and provider of information services and research on the real estate industry for brokers, real estate professionals and the public. We serve the Twin Cities 16-county metro area and western Wisconsin.
From The Skinny Blog.

