Tuesday, January 27th, 2026

Housing recovery pushed forward during October. Just like most of this year, more homes sold in less time at higher prices and for closer to asking price than last year. During October, 4,483 homes went under contract, 34.0 percent higher than October 2011. There were 4,262 closed sales, a 15.1 percent increase over last year. The median sales price was up 14.8 percent to $175,000.

The 10K Housing Value Index showed a 7.4 percent increase to $172,804. Seller confidence is improving, as 5,301 homes were placed onto the market, 7.5 percent more than last year at this time. The number of homes for sale fell 29.7 percent to 15,002 active listings—the lowest number since before January 2003.

The median sales price has now risen for eight consecutive months. That’s being driven by three primary factors: less supply, more demand and a healing distressed segment. Overall, new listings were up 7.5 percent, but traditional new listings were up 25.4 percent while both foreclosure and short sale new listings were down 7.5 and 31.6 percent, respectively.

Prices were up across the board. The overall median sales price was up 14.8 percent to $175,000; the traditional median price was up 9.6 percent to $212,500; the foreclosure price was up 15.2 percent to $123,500; and the short sale price was up 4.2 percent to $131,871, only the second year-over-year gain since June 2008.

Traditional sales made up 64.4 percent of sales, foreclosures 25.1 percent and short sales 10.5 percent.

The number of homes for sale has dropped for 21 consecutive months and is just above 15,000, the lowest level for any month since January 2003. Months’ supply of inventory fell 41.4 percent to 3.7 months. This indicates that the market is on the brink of favoring sellers. Figures below 4.0 months of supply are typically hallmarks of sellers’ markets.

Sellers can take some comfort in these ongoing improvements. Homes sold in an average of 104 days, 24.8 percent less time than last October. Sellers, on average, received 94.4 percent of their list price, 3.5 percent more than last year. Cash buyers made up 21.2 percent of all closed sales.

Tuesday, January 27th, 2026

The last time you were at the doctor, your vital signs were checked – heart rate, pulse, temperature and blood pressure. Progress was documented and valuable insights were gained, whether it was a routine visit or one of many checks during an extended hospital stay. The housing market has been in and out of intensive care for the past several years. Monitoring vitals matters, and that’s what you’ll find on the following pages. The pulse of today’s market indicates that we may be getting ready to leave the ICU. So if you could just please pull up your sleeve, let’s check your blood pressure.

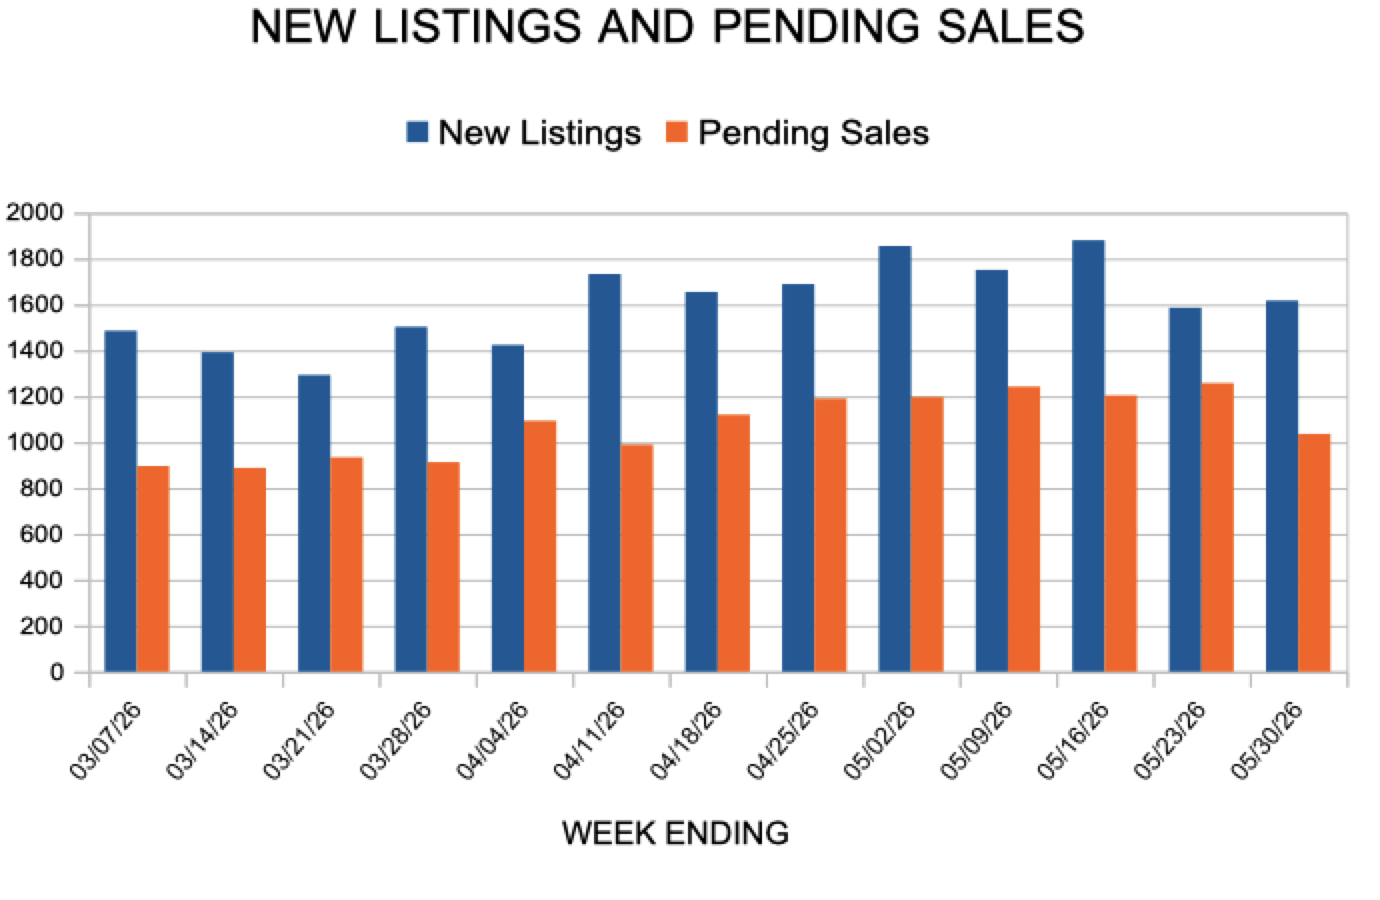
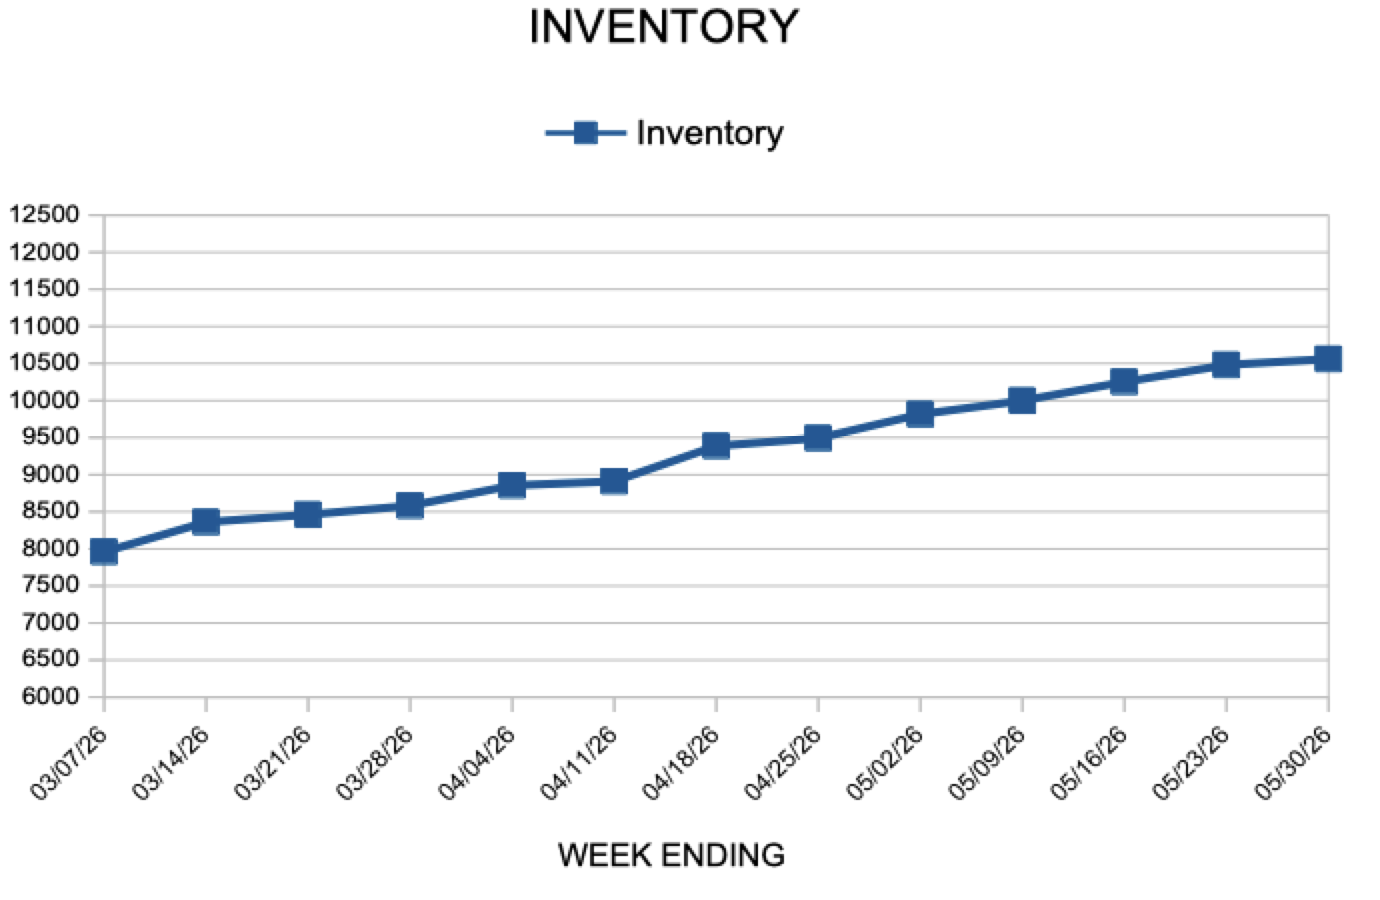
In the Twin Cities region, for the week ending March 24:

  • New Listings increased 2.2% to 1,414
  • Pending Sales increased 30.2% to 1,052
  • Inventory decreased 27.3% to 17,193

For the month of February:

  • Median Sales Price decreased 1.4% to $138,000
  • Days on Market decreased 9.0% to 145
  • Percent of Original List Price Received increased 2.5% to 90.6%
  • Months Supply of Inventory decreased 34.8% to 4.7

Click here for the full Weekly Market Activity Report.

From The Skinny.

Monday, January 26th, 2026
For Week Ending January 17, 2026

The average 30-year fixed mortgage rate fell to 6.06% the week ending January 15, 2026, the lowest level since September 2022, according to Freddie Mac. The Mortgage Bankers Association noted that lower rates have coincided with a rise in purchase and refinance applications, as borrowers respond to recent improvements in affordability.

IN THE TWIN CITIES REGION, FOR THE WEEK ENDING JANUARY 17:

  • New Listings decreased 3.6% to 914
  • Pending Sales decreased 15.1% to 512
  • Inventory decreased 1.3% to 7,441

FOR THE MONTH OF DECEMBER:

  • Median Sales Price increased 2.7% to $380,000
  • Days on Market increased 3.6% to 58
  • Percent of Original List Price Received decreased 0.2% to 96.8%
  • Months Supply of Homes For Sale decreased 5.0% to 1.9

All comparisons are to 2025

Click here for the full Weekly Market Activity Report. From MAAR Market Data News.

The post Weekly Market Report appeared first on Mighty Agent.

Posted in Weekly Report |
Monday, January 12th, 2026
For Week Ending January 3, 2026

The National Association of REALTORS® (NAR) forecasts a 14% increase in existing-home sales in 2026, alongside a 5% rise in new-home sales. These gains are being fueled by steady job growth, softening mortgage rates, and improving overall market conditions. Home prices are projected to grow 4% this year, reflecting sustained demand and ongoing inventory constraints.

IN THE TWIN CITIES REGION, FOR THE WEEK ENDING JANUARY 3:

  • New Listings decreased 18.9% to 586
  • Pending Sales decreased 11.8% to 387
  • Inventory decreased 2.6% to 7,683

FOR THE MONTH OF NOVEMBER:

  • Median Sales Price increased 2.9% to $387,000
  • Days on Market remained flat at 50
  • Percent of Original List Price Received decreased 0.2% to 97.4%
  • Months Supply of Homes For Sale remained flat at 2.5

All comparisons are to 2025

Click here for the full Weekly Market Activity Report. From MAAR Market Data News.

Posted in Uncategorized |
Monday, January 5th, 2026
For Week Ending December 27, 2025

Nationally, 46.1% of mortgaged residential properties were classified as equity-rich in the third quarter of 2025, according to ATTOM’s latest 2025 U.S. Home Equity & Underwater Report. This marks a slight decline from 47.4% the previous quarter and from 48.3% the same time last year. The three states with the highest share of equity-rich properties were Vermont (86.8%), New Hampshire (61.4%), and Rhode Island (59.8%).

IN THE TWIN CITIES REGION, FOR THE WEEK ENDING DECEMBER 27:

  • New Listings decreased 22.4% to 267
  • Pending Sales decreased 11.9% to 376
  • Inventory decreased 2.9% to 7,964

FOR THE MONTH OF NOVEMBER:

  • Median Sales Price increased 2.9% to $387,000
  • Days on Market remained flat at 50
  • Percent of Original List Price Received decreased 0.2% to 97.4%
  • Months Supply of Homes For Sale remained flat at 2.

All comparisons are to 2024

Click here for the full Weekly Market Activity Report. From MAAR Market Data News.

Posted in Weekly Report |