Monday, March 9th, 2020

For Week Ending February 29, 2020

The U.S. Commerce Department reported this week that new-home sales rose 7.9% in January to a seasonally adjusted annual rate of 764,000 units, which is 18.6% higher than a year ago and the highest monthly sales pace since July 2007. While new-home sales are increasing, new-home inventories fell 6.6% from a year ago and are now the lowest since 2017. The National Association of REALTORS® and others are calling on home builders to increase residential home construction to meet increased demand, but a labor shortage, higher costs of construction and possible supply-chain disruption due to COVID-19 may limit homebuiders’ ability to respond to the increased demand.

In the Twin Cities region, for the week ending February 29:

  • New Listings increased 8.0% to 1,395
  • Pending Sales increased 12.2% to 1,083
  • Inventory decreased 13.1% to 7,785

For the month of January:

  • Median Sales Price increased 4.2% to $270,000
  • Days on Market increased 3.1% to 67
  • Percent of Original List Price Received decreased 0.1% to 97.0%
  • Months Supply of Homes For Sale decreased 11.1% to 1.6

All comparisons are to 2019

Click here for the full Weekly Market Activity Report. From MAAR Market Data News.

Posted in Weekly Report |
Monday, March 2nd, 2020

For Week Ending February 22, 2020

The ShowingTime Showing Index® for January saw a 20.2 percent year-over-year increase in showing traffic nationwide. All regions of the country were up double-digits from the year before, with the Midwest Region up 15.7 percent and the West Region, up 34.1 percent. As showing activty is a leading indicator for future home sales, the 2020 housing market is off to a strong start.

In the Twin Cities region, for the week ending February 22:

  • New Listings increased 31.4% to 1,269
  • Pending Sales increased 20.8% to 1,073
  • Inventory decreased 14.4% to 7,734

For the month of January:

  • Median Sales Price increased 4.2% to $270,000
  • Days on Market increased 3.1% to 67
  • Percent of Original List Price Received decreased 0.1% to 97.0%
  • Months Supply of Homes For Sale decreased 11.1% to 1.6

All comparisons are to 2019

Click here for the full Weekly Market Activity Report. From MAAR Market Data News.

Posted in Weekly Report |
Monday, February 24th, 2020

For Week Ending February 15, 2020

According to the latest REALTORS® Confidence Index Survey of more than 8,000 real estate respondents, one in four home sales faced a settlement delay in December 2019. Seventy-one percent closed on time and four percent were canceled altogether. The biggest reasons cited for a delayed closing were issues related to financing (37%), appraisal issues (19%), and home inspection/environmental issues (17%).

In the Twin Cities region, for the week ending February 15:

  • New Listings increased 9.6% to 1,156
  • Pending Sales increased 13.9% to 967
  • Inventory decreased 14.8% to 7,692

For the month of January:

  • Median Sales Price increased 4.2% to $270,000
  • Days on Market increased 3.1% to 67
  • Percent of Original List Price Received decreased 0.1% to 97.0%
  • Months Supply of Homes For Sale decreased 11.1% to 1.6

All comparisons are to 2019
Click here for the full Weekly Market Activity Report. From MAAR Market Data News.

Posted in Weekly Report |
Monday, February 24th, 2020

For 2020, the National Association of REALTORS’ Chief Economist, Lawrence Yun, sees good news for home prices.

Posted in Monthly Skinny Video |
Monday, February 24th, 2020

February 22, 2020

Latest housing report also shows falling inventory and rising prices

According to the latest housing report from the Minneapolis Area REALTORS® and the Saint Paul Association of REALTORS®, Twin Cities residential real estate started 2020 on solid but still uneven footing. Buyers were eager to ignite the spring market early, spurred by incredibly low mortgage rates and favorable weather, especially compared to last year. Tempering the market are falling inventory and rising prices.

“Buyers were again spoiled by rates that no one expected would be this low,” said Linda Rogers, President of Minneapolis Area REALTORS®. “That’s fueled more sales activity but we’re still missing the inventory piece.”

Sellers listed fewer homes for sale while buyers signed more purchase agreements and closed more deals. As a result, the number of homes for sale was almost 15 percent lower than last January. The supply squeeze wasn’t felt evenly across price points, though. While inventory of homes priced below $250,000 fell, the number of listings priced between $250,000 and $500,000 as well as $500,000 to $1,000,000 increased last month.

“The year is off to a solid start and metro area communities each have a unique story to tell when it comes to housing availability and price,” said Patrick Ruble, President of St. Paul Area Association of REALTORS®.

Some of the most competitive markets experiencing strong price growth are those with relatively higher levels of affordable or entry-level homes, such as Fridley, Vadnais Heights, Richfield, Brooklyn Center and Bloomington. That’s where multiple offers and homes selling for over list price are more common. Both millennial first-time buyers and downsizing empty nesters are competing over this limited supply of affordable homes close to the core cities. The move-up and upper-bracket home price segments are more balanced and better supplied.

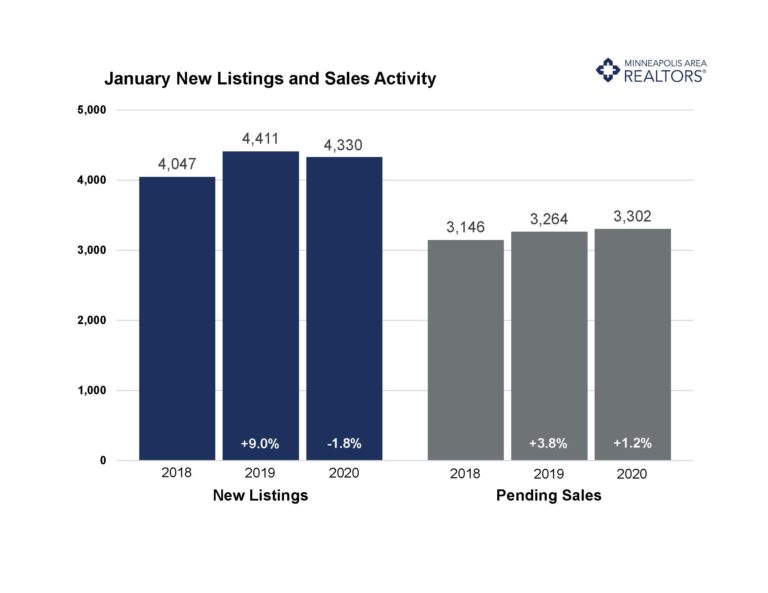
January 2020 by the numbers (compared to a year ago)

  • Sellers listed 4,330 properties on the market, a 1.8 percent decrease from last January
  • Buyers closed on 2,870 homes, a 5.4 percent increase
  • Inventory levels declined 14.9 percent to 7,595 units
  • Months Supply of Inventory was down 16.7 percent to 5 months (5-6 months is balanced)
  • The Median Sales Price rose 4.2 percent to $270,000
  • Cumulative Days on Market increased 1.5 percent to 66 days, on average (median of 43)
  • Changes in Sales activity varied by market segment
    • Single family sales rose 5.5 percent; condo sales fell 3.5 percent; townhome sales rose 11.7 percent
    • Traditional sales increased 7.1 percent; foreclosure sales dropped 26.0 percent; short sales fell 52.6 percent
    • Previously owned sales were up 5.5 percent; new construction sales climbed 11.1 percent

From The Skinny Blog.

Posted in The Skinny |