New highs for showings hint at buyer confidence, but supply questions remain
(June 18, 2020) – According to new data from the Minneapolis Area REALTORS® and the Saint Paul Area Association of REALTORS®, market activity was down from last May but increased from this April.The number of residential showings has reached a new high for the year. The decline in pending sales was about half that of new listings, as buyers were motivated by record-low mortgage rates. Pending sales were down just 2.5 percent in the $350-500K price range but fell 34.8 percent on homes between $750K-1M. For new listings, the reverse was true with the biggest declines in the affordable price range of $150-190K and the smallest drop in new listings for homes over $1M.
“Activity is moving through the system—fewer April contracts now means fewer closed sales in May,” said Linda Rogers, President of Minneapolis Area REALTORS®. “But smaller declines in May contracts combined with strong showing activity are reasons for cautious optimism.”Home prices rose to about $295K compared to last May, but it was the smallest percentage gain since January 2017. April was the first month on record where the median home price surpassed $300K. Homes also sold more quickly this May than last, as motivated buyers remained committed, but less serious buyers and “lookers” were not as active. The share of their list price that sellers received declined to 99.6 percent from 100.0 percent last May.
“We expected May to be a slight improvement from April and so far that is mostly true,” said Patrick Ruble, President of the St. Paul Area Association of REALTORS®. “Not only is showing activity displaying some strength, but the home buyers and sellers we work with are starting to feel more confident as well. Rates are at historic lows and should remain low throughout the year.”
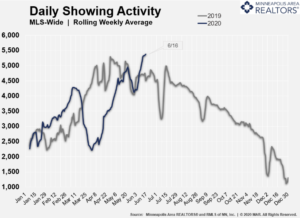
Showing activity rose by 11.0 percent from the most recent week compared to the week prior and has reached new highs. The economic toll impacted market segments differently. First-time buyers are more likely to be impacted by job losses in the leisure, hospitality or retail space, while those shopping in the luxury brackets may be impacted by turmoil in equity and energy markets. The middle-market ranges are outperforming, helped along by professionals who can work from home. Given the lack of supply—especially close to the core cities—and price points in the low $400s, the new home market is more stable than the existing resale market.
Mortgage rates on a 30-year fixed loan are around 3.25 percent—the lowest they have ever been. While recessions can pause market activity, they typically only have a minor impact on home prices. A persistently undersupplied market—particularly for affordable homes—may help prices stay afloat.
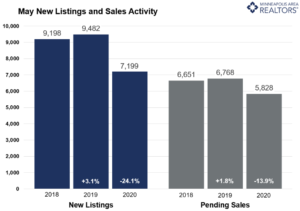
May 2020 by the numbers compared to a year ago
- Sellers listed 7,199 properties on the market, a 24.1 percent decrease from last May
- Buyers signed 5,828 purchase agreements, down 13.9 percent (4,728 closed sales, down 22.4 percent)
- Inventory levels declined 20.3 percent to 9,744 units
- Months Supply of Inventory was down 20.0 percent to0 months (5-6 months is balanced)
- The Median Sales Price rose 3.5 percent to $294,900
- Cumulative Days on Market decreased 8.9 percent to 41 days, on average (median of 16)
- Changes in Sales activity varied by market segment
- Single family sales fell 9.2 percent; condo sales were down 38.6 percent; townhome sales declined 18.4 percent
- Traditional sales decreased 13.2 percent; foreclosure sales dropped 4.3 percent; short sales fell 30.8 percent
- Previously owned sales were down 13.8 percent; new construction sales declined 0.5 percent
From The Skinny Blog.
