SIZABLE GAINS IN LISTINGS AND SALES DESPITE RATE ENVIRONMENT
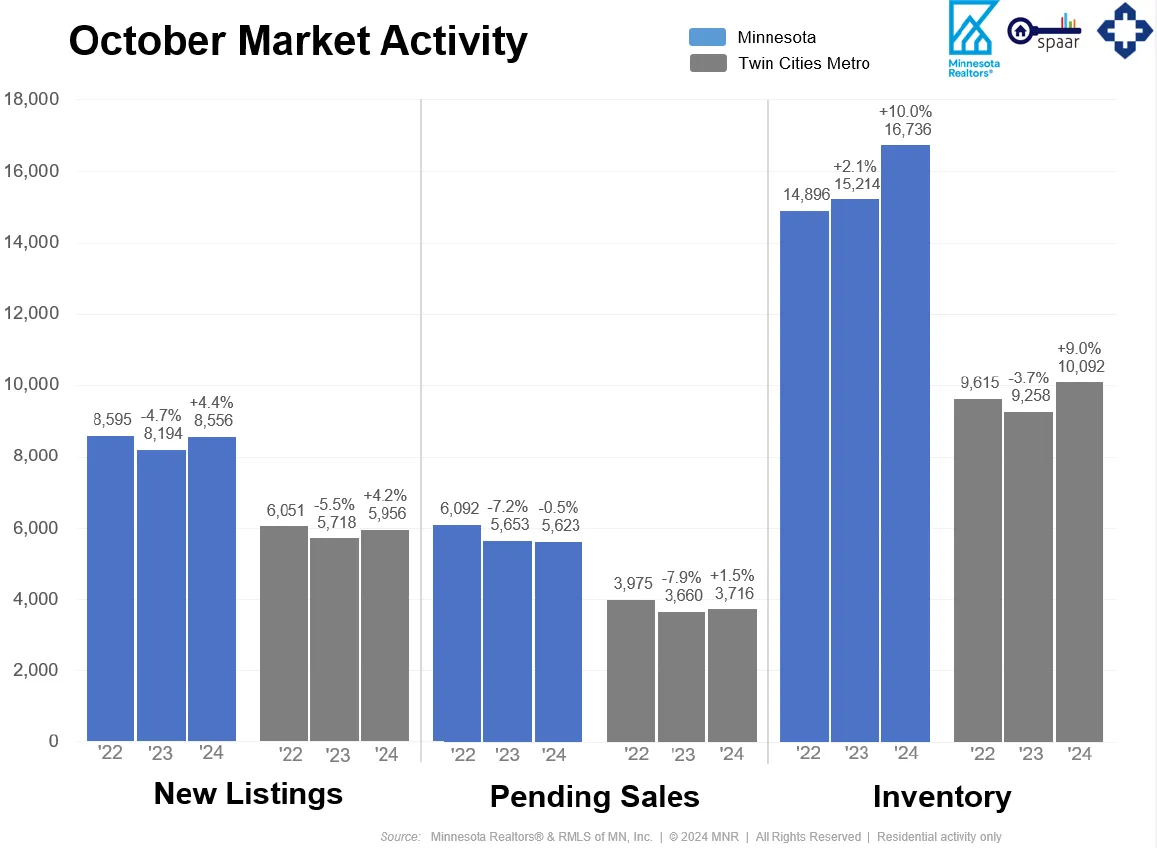
- Signed purchase agreements were up 10.4% statewide, and new listings were up 9.1%
- The median sales price increased 5.3% to $347,500
- Market times rose 10.5% to 42 days, and inventory was up 8.2% to 16,281
(Nov. 14, 2024) – According to new data from the Minnesota state and Twin Cities metro REALTOR® Associations, listings, sales, prices and inventory all rose in October.
Sellers, Buyers and Housing Supply
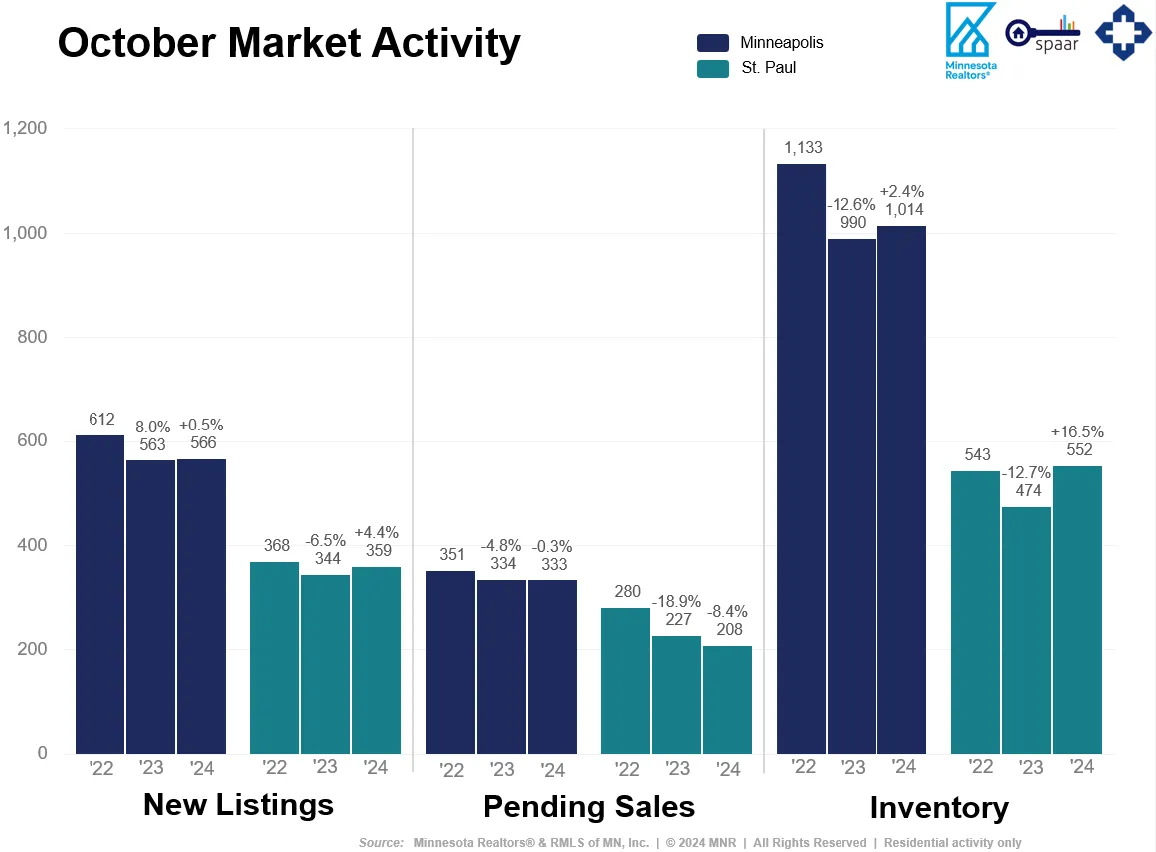
Mortgage rates hovered between 6.0–7.0% all month long, but buyers seem to be adjusting to the current rate environment as pending sales rose a strong 10.4% statewide and 14.3% in the metro. The average 30-year mortgage rate was 6.18% in September and 6.43% in October. With the exception of September, rates haven’t been that low since May of 2023. The pent-up activity is on the supply side, too. Most sellers are also buyers, and those who chose to delay their move are getting restless. While they’ll be met with more inventory, they may not see the most ideal interest rate. Still, new listings were up 9.1% statewide and 8.7% in the metro compared to last October.
Despite recent gains, supply levels remain low due to a lack of new home construction. Existing sellers who would ordinarily move up the housing ladder and free up their first-time home feel “locked in” to their favorable mortgage rates. Those rates are often between 3.0–4.0% or lower compared to nearly 7.0% today. The Federal Housing Finance Agency (FHFA) has found that about 70% of all outstanding mortgages are financed below 4.0%. There are signs of change, but housing demand has fallen due to the affordability crisis. The persistent housing shortage kept home prices rising, just as the Federal Reserve hiked interest rates to combat inflation. Prospective home buyers are still feeling the triple punch of higher prices, higher mortgage rates, and limited inventory. While home prices are still rising, wage growth has been exceeding the rate of inflation. In fact, the U.S. Bureau of Labor Statistics reports that wages are rising at 4.6% while inflation is rising at 2.4%.
“We see buyers adjusting to today’s mortgage rates, but experienced Realtors know there are many ways to get deals done,” said Geri Theis, President of Minnesota Realtors®. “Having a strong Realtor negotiating on your behalf, directing you to down payment resources and offering suggestions on timelines and contingencies will help you stand out against your competition and ultimately help you close the deal.”
Prices, Market Times and Negotiations
Every area and market segment is unique. Some listings are getting multiple offers and closing for over list price. But overall, sellers accepted offers at 97.1% of list price statewide and 97.8% in the metro—both down from last year. And those offers were accepted after an average of 42 days on market statewide and 45 days in the metro—both figures up from a year ago. “We’re seeing different activity in different price points, areas and segments such as condos or new construction,” said Jamar Hardy, President of Minneapolis Area REALTORS®. “What’s impacting $1M+ buyers isn’t necessarily on the mind of a $300,000 buyer, and condos and new construction are better supplied and more accessible than the existing single-family market, for example.”
The state median home price was up 5.3% to $347,500, and the metro median price was up 4.1% to $380,000. A slowdown in price growth would give incomes a chance to catch up, helping address affordability concerns. And additional inventory will mean less upward price pressure from a persistent supply shortage. It would also allow buyers to have more options from which to choose. “Sales numbers confirm some of the renewed optimism I’m seeing in today’s housing market given better rates and more inventory,” said Amy Peterson, President of the Saint Paul Area Association of REALTORS®. “While many sellers and buyers feel now is the right time to make a move, it’s still important to consider their goals in taking that next step and negotiating offers.”
Locational Differences | Minnesota statewide
Market activity always varies by area, price point and property type. Regions such as Duluth and the North Shore and Hibbing/Virginia saw the largest gains in seller activity. Alexandria, St. Cloud and the Twin Cities had the largest gains in pending sales. Homes sold the fastest in the Duluth/North Shore region along with St. Cloud. Prices were highest in the metro followed by Detroit Lakes and Rochester. The most affordable regions of the state were Hibbing/Virginia and Willmar. Every region is undersupplied except Hibbing/Virginia, Detroit Lakes and Bemidji, which are relatively well balanced.
Locational Differences | Twin Cities Metro
For cities with at least five sales, Afton, Columbus and Arden Hills had the largest sales gains. The highest priced areas were Orono, Afton and North Oaks while the most affordable areas were South St. Paul, Brooklyn Center and Isanti. But the largest increases in sales price were in Afton, Orono and Hopkins. The most oversupplied markets were Clear Lake, Centerville and Cokato while the most undersupplied markets were Oak Park Heights, North St. Paul and Mound. Homes took the longest to sell in Mayer, Columbus and Centerville and sold the fastest in Norwood, Greenfield and New Brighton.
From The Skinny Blog.
 For Week Ending November 9, 2024