- The median sales price was up 0.5 percent from last June to $382,000
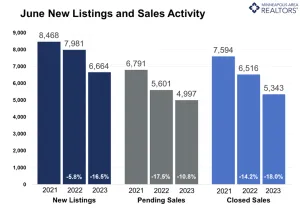
- Signed purchase agreements fell 10.8 percent; new listings down 16.5 percent
- Sellers accepted offers for an average of 101.3 percent of their list price
(July 16, 2023) – According to new data from Minneapolis Area REALTORS® and the Saint Paul Area Association of REALTORS®, home prices rose slightly in June. Both buyer and seller activity were also lower compared to last June.
Sales & Prices
Prices were down slightly in April and May but up 0.5 percent in June. April marked the first year-over-year price decline since February 2012. Half of all homes sold for over $382,000. But as in April and May, sellers in June still accepted offers above list price despite a decline in sales—a dynamic that reflects the lack of supply despite rising mortgage rates. Sellers received offers at 101.3 percent of their asking price. Market times—while up—still reflect a relatively fast-paced market. Half the sales went under contract in under 12 days. And homes are still selling faster than in June 2018, 2019 and 2020.
“Some remain convinced of an impending crash, but we’re still not seeing it,” said Brianne Lawrence, President of the Saint Paul Area Association of REALTORS®. “Two months of prices softening around 1.0 percent before climbing again is more like a blip or pause than a downturn.” But the Fed-driven decline in demand persists. As we compare to slower months of 2022, the sales declines have moderated. Pending sales dipped 10.8 percent; closed sales fell 18.0 percent.
Listings and Inventory
June sellers brought 16.5 percent fewer new listings to market than last year. Inventory levels slid 9.0 percent lower. Some sellers are choosing to stay put and wait instead of selling for a lower price. Most sellers are also buyers and are reluctant to trade away their 3.0 percent interest rate for 6.8 percent. “Even with fewer sales in light of higher rates, homes are still selling relatively quickly while sellers get relatively strong offers,” said Jerry Moscowitz, President of Minneapolis Area REALTORS®. “That’s partly driven by homeowners with rates under 4.0 percent staying put.”
Both supply and demand have come down in tandem, meaning the balance between buyer and seller activity has remained tight. Inventory levels fell 13.4 percent in June to 7,492 active listings. The market still favors sellers, but not to the same degree as the last few years. Our 2.0 months supply of inventory was up 17.6 percent. Typically 4-6 months of supply are needed to achieve a balanced market.
Location & Property Type
Market activity varies by area, price point and property type. New home sales rose 24.3 percent while existing home sales were down 12.8 percent. Single family sales fell 13.7 percent, condo sales declined 3.2 percent and townhome sales were up 0.8 percent. Sales in Minneapolis decreased 12.1 percent while Saint Paul sales fell 12.9 percent. Cities such as Annandale, Shorewood, White Bear Township and Delano saw the largest sales gains while White Bear Lake, New Hope, New Prague, Zimmerman and Hudson all had notably lower demand than last year.
June 2023 Housing Takeaways (compared to a year ago)
- Sellers listed 6,664 properties on the market, a 16.5 percent decrease from last June
- Buyers signed 4,997 purchase agreements, down 10.8 percent (5,343 closed sales, down 18.0 percent)
- Inventory levels shrank 13.4 percent to 7,492 units
- Month’s Supply of Inventory rose 17.6 percent to 2.0 months (4-6 months is balanced)
- The Median Sales Price rose 0.5 percent to $382,000
- Days on Market rose 47.6 percent to 31 days, on average (median of 12 days, up 50.0 percent)
- Changes in Sales activity varied by market segment
- Single family sales decreased 13.7 percent; Condo sales were down 3.2 percent & townhouse sales rose 0.8 percent
- Traditional sales declined 11.0 percent; foreclosure sales rose 76.0 percent (44); short sales decreased 33.3 percent (4)
- Previously owned sales were down 12.8 percent; new construction sales rose 24.3 percent
- Sales under $500,000 fell 12.9 percent; sales over $500,000 declined 0.4 percent
From The Skinny Blog.
 For Week Ending July 22, 2023