Thursday, August 6th, 2015
By David Arbit on Wednesday, August 5th, 2015

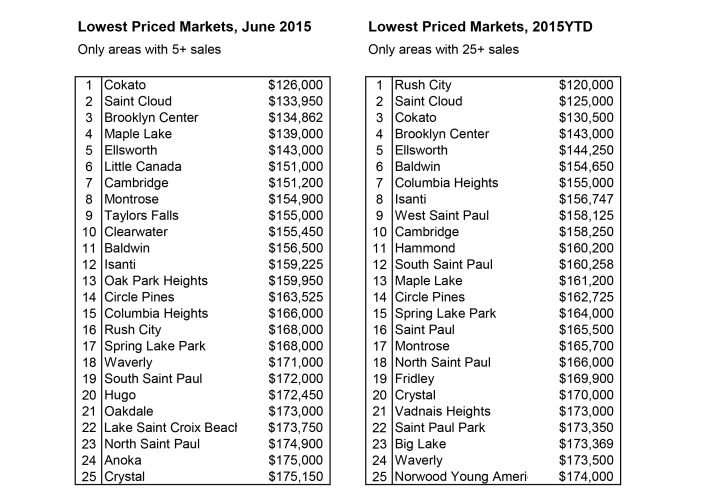
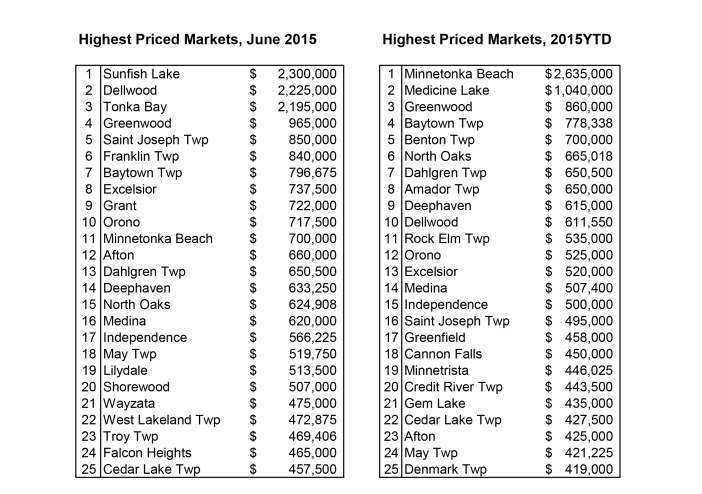
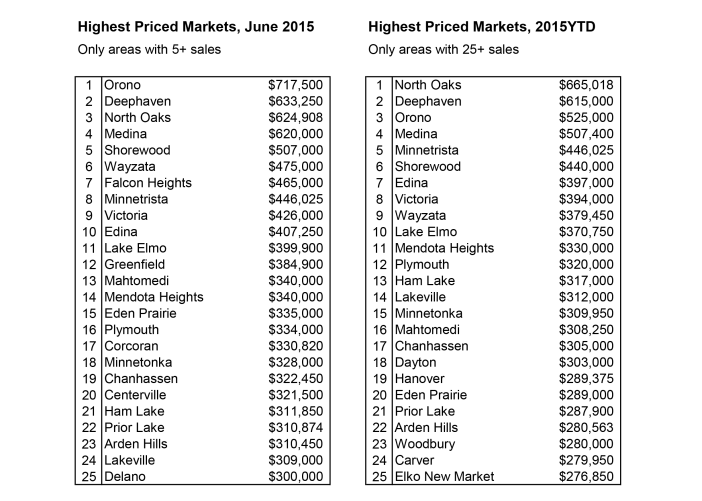
Though not quite as often as the most expensive areas, we are also occasionally asked which cities are the most affordable (least expensive). Below are tables showing the 25 lowest priced markets in the region. The top two tables rank all areas, regardless of market size. The bottom two tables only show areas with a certain volume of sales. The left table uses only June 2015 sales, while the table to the right uses 2015 YTD data (through June). The measure used is still median sales price.

Even more data to the people!

Lowest-Priced-Cities-7-2015-702x485

Lowest-Priced-Cities-7-2015-with-restrictions-702x501
From The Skinny Blog.

Posted in The Skinny |
Monday, August 3rd, 2015

For Week Ending July 25, 2015

According to the U.S. Census, homeownership is at 63.4 percent for the second quarter of 2015, down 1.3 percent from the second quarter of 2014. This is the lowest rate of homeownership since 1967. To put that in greater context, homeownership peaked at 69.2 percent in 2004, and the 50-year average is 65.3 percent. Although the data may be indicating otherwise on a macro level, mortgage applications have kept REALTORS® busy through summer.

In the Twin Cities region, for the week ending July 25:

  • New Listings increased 1.2% to 1,804
  • Pending Sales increased 21.3% to 1,362
  • Inventory decreased 9.8% to 17,125

For the month of June:

  • Median Sales Price increased 4.7% to $229,900
  • Days on Market decreased 5.7% to 66
  • Percent of Original List Price Received increased 0.5% to 97.7%
  • Months Supply of Inventory decreased 15.9% to 3.7

All comparisons are to 2014

Click here for the full Weekly Market Activity Report. From The Skinny Blog.

Posted in Weekly Report |
Thursday, July 30th, 2015
By David Arbit on Wednesday, July 29th, 2015

We are often asked “Which cities have the highest home prices?” Whether it’s a member, the media or the general public inquiring, it’s a fairly common question. Wonder no more! Below are tables showing the top 25 highest priced markets in the region. The top two tables rank all areas, regardless of market size. The bottom two tables only show areas with a certain volume of sales. The left table uses just June 2015 sales, while the table to the right uses 2015 YTD data. Of course, the measure used is median sales price.

Data to the people!

Highest-Priced-Cities-7-20151-702x494
Highest-Priced-Cities-7-2015-with-restrictions1-702x501

From The Skinny Blog.

Posted in The Skinny |
Monday, July 27th, 2015

For Week Ending July 18, 2015

Let’s try to never forget how bad the U.S. housing market got. The Great Recession lasted from about December 2007 to June 2009. Ever since then, and particularly in the last couple of years, the market has strengthened to once again become a cornerstone in one of the strongest economies in the world. Better lending standards, low oil prices and higher wages are a few of the catalysts for positive change. As we tip into the second half of 2015, the trends still reveal stable housing in a stable economy.

In the Twin Cities region, for the week ending July 18:

  • New Listings decreased 7.8% to 1,758
  • Pending Sales increased 7.7% to 1,210
  • Inventory decreased 9.1% to 16,973

For the month of June:

  • Median Sales Price increased 4.7% to $229,900
  • Days on Market decreased 5.7% to 66
  • Percent of Original List Price Received increased 0.5% to 97.7%
  • Months Supply of Inventory decreased 15.9% to 3.7

All comparisons are to 2014

Click here for the full Weekly Market Activity Report. From The Skinny Blog.

Posted in Weekly Report |