Monday, March 20th, 2017

For Week Ending March 11, 2017

In the last three months, the Federal Reserve has now twice increased its benchmark interest rate a quarter point. The good news is that this was an expected move due to strong confidence in the economy. Mortgage rates will likely increase as well. That said, homes are still selling quickly, and there is little indication that the trend will slow down in the spring and summer months.

In the Twin Cities region, for the week ending March 11:

  • New Listings decreased 3.3% to 1,740
  • Pending Sales decreased 11.1% to 1,102
  • Inventory decreased 24.8% to 9,290

For the month of February:

  • Median Sales Price increased 7.7% to $223,250
  • Days on Market decreased 14.6% to 82
  • Percent of Original List Price Received increased 1.4% to 96.5%
  • Months Supply of Inventory decreased 28.0% to 1.8

All comparisons are to 2016

Click here for the full Weekly Market Activity Report. From The Skinny Blog.

Posted in Weekly Report |
Monday, March 13th, 2017

For Week Ending March 4, 2017

Tight inventory, lower affordability and higher mortgage rates continue to dominate residential real estate news, but a declining unemployment rate offers a bright spot. Employment in the construction industry had some of the largest gains. It would be great to see this increase translate into an impact on the construction of new homes for sale.

In the Twin Cities region, for the week ending March 4:

  • New Listings decreased 11.9% to 1,727
  • Pending Sales increased 0.3% to 1,155
  • Inventory decreased 23.4% to 9,042

For the month of February:

  • Median Sales Price increased 7.6% to $223,000
  • Days on Market decreased 14.6% to 82
  • Percent of Original List Price Received increased 1.4% to 96.5%
  • Months Supply of Inventory decreased 28.0% to 1.8

All comparisons are to 2016

Click here for the full Weekly Market Activity Report. From The Skinny Blog.

Posted in Weekly Report |
Monday, March 6th, 2017

For Week Ending February 25, 2017

As mortgage rates rise, median sales prices increase and stiff competition for low inventory continues, buyers are beginning to face some limitations with their housing options, especially for first-time buyers. That being said, for most weeks in 2017, sales have been higher in year-over-year comparisons with the same weeks in 2016.

In the Twin Cities region, for the week ending February 25:

  • New Listings decreased 7.6% to 1,345
  • Pending Sales decreased 6.7% to 980
  • Inventory decreased 23.7% to 8,950

For the month of January:

  • Median Sales Price increased 4.6% to $224,900
  • Days on Market decreased 7.1% to 79
  • Percent of Original List Price Received increased 0.9% to 95.9%
  • Months Supply of Inventory decreased 26.1% to 1.7

All comparisons are to 2016

Click here for the full Weekly Market Activity Report. From The Skinny Blog.

Posted in Weekly Report |
Monday, March 6th, 2017

By David Arbit on Tuesday, February 28th, 2017
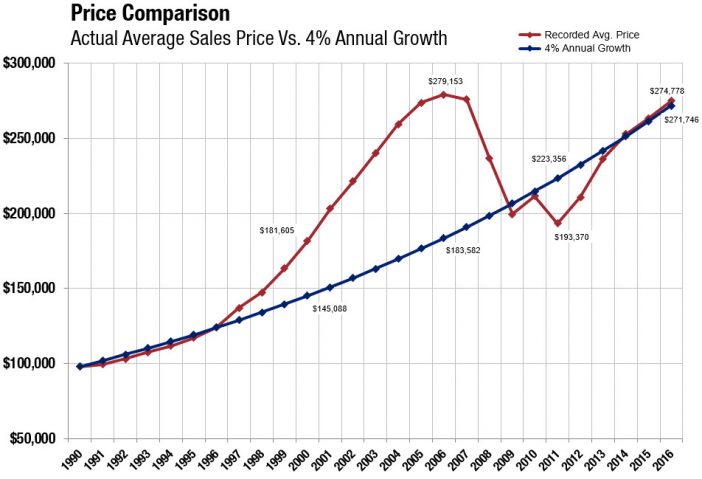
4-pct-annual-growth-702x479© MAAR 2017 | All rights reserved.

We have all heard the saying “everything eventually reverts to the mean.” No? Fair enough. There’s a saying that goes “everything eventually reverts to the mean.” It’s a way of expressing that, over a sufficient time period, a data set can only remain above or below its long-term trend for so long, but eventually should come back in line with historical averages or growth rates. Applied to our industry, home prices could only stay above trend for so long. Alas, the gravitational pull of market forces is a powerful and unrelenting wonder (with mostly measurable and rational underpinnings).

Take, for example, the graphic above which plots reported average home prices alongside 4.0 percent steady annual growth per year. Both trendlines start at the same point–the reported averages sales price in 1990. After the early 1990s ran slightly below trend, 1997-2008 way above trend, 2009-2013 well below trend and 2014-2016 slightly above trend, we are right back in line with where the 4.0 percent growth trend is. This is why some economists use a pendulum analogy when discussing market forces. Markets tend to over-swing “balance” or “equilibrium.” With so much momentum, they tend to move from one extreme to another, without stopping in the middle. We tend to lurch from buyer’s markets to seller’s markets to buyer’s markets and now back to a seller’s market.

Huh. Funny how that works. All the fuss, all the lost equity, all the subsequent appreciation, all those foreclosures, all the boom-bust cycles, all those debates about over or under-regulated wall street banks and mortgage markets and whether housing can go higher still and if incomes can keep up. And for what?

Home prices ended up more or less where they belong. We’ve reverted right back to our historical growth trend. The market is back where it should be had housing appreciated at a steady 4.0 percent per year.

It’s not just housing, commodity and capital markets that gravitate back to their long-term trajectories. Sea turtles, sockeye salmon and other members of the animal kingdom also understand the instinctual pull of home. No matter how far they roam, they travel vast distances to return to their original habitat–the environment that gives them a sense of familiarity and balance.

From The Skinny Blog.

Posted in The Skinny |
Monday, February 27th, 2017

For Week Ending February 18, 2017

In much of the country, both new and existing home sales increased in January. At the same time, prices continue to rise in year-over-year comparisons, and the number of homes available for sale remains quite low. The low inventory situation and affordability crunch is particularly hard on first-time buyers, leaving some properties available for landlord buyers with more available funds for investment.

In the Twin Cities region, for the week ending February 18:

  • New Listings decreased 6.5% to 1,334
  • Pending Sales increased 11.1% to 989
  • Inventory decreased 23.8% to 8,751

For the month of January:

  • Median Sales Price increased 4.7% to $225,000
  • Days on Market decreased 7.1% to 79
  • Percent of Original List Price Received increased 0.9% to 95.9%
  • Months Supply of Inventory decreased 26.1% to 1.7

All comparisons are to 2016

Click here for the full Weekly Market Activity Report. From The Skinny Blog.

Posted in Weekly Report |