Right around the time when second-hand shops receive an influx of donated exercise equipment, we get our first glimpse of the year at our local housing market. Overall, it was a healthy and balanced start to the new year. New listings rose 3.1 percent to 4,304—the second strongest gain in nearly a year. Pending sales increased 4.3 percent compared to last January. Given the rush to lock in interest rates and close deals before the end of 2016, closed sales lagged slightly.
When it comes to inventory, the market is still feeling deprived. There were only 8,212 for-sale properties last month, 25.4 percent fewer than last January. That officially marks a 14-year record low for inventory. The median sales price increased 4.7 percent from last year to $225,000. Additional supply is a missing piece of this recovery and is critically needed. Competing bids on the most attractive properties are common in low inventory environments, and homes tend to sell quickly for close to or above list price. Average days on market until sale fell 7.1 percent to 79 days compared to 85 in January 2016. The average percent of original list price received at sale was 95.9 percent, 0.9 percent higher than last January. But the median days on market fell to 53 days and the median percent of current list price received increased to 98.9 percent. Given strong demand of late, the marketplace has only 1.6 months of supply—the lowest figure on record for any month since January 2003. This indicator measures the balance between supply and demand. Generally, five to six months of supply is considered a balanced market.
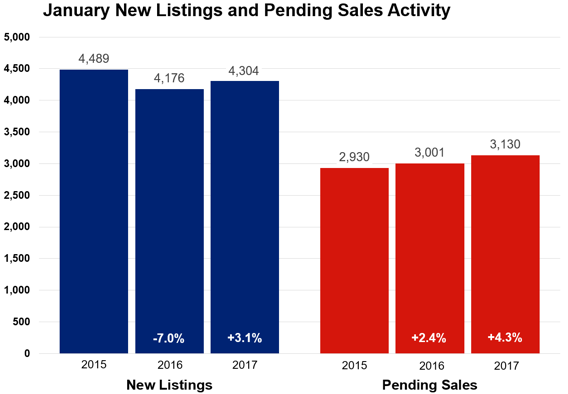
“Both buyers and sellers were feeling confident compared to January 2016,” said Cotty Lowry, Minneapolis Area Association of REALTORS® (MAAR) President. “It is obviously still early in the year, but that increase in new listings was the second strongest gain in about a year. If that is sustained, we should be able to achieve the balancing act of steady price gains while maintaining our affordability.”
Though single family sales dominate the Twin Cities market by number, townhome sales showed the largest year-over-year sales increase followed by condos. Similarly, though previously-owned properties make up the largest share of sales, new construction properties had a much larger year-over-year sales increase. The most active price range over the last 12 months is $190,000 to $250,000 but the largest gain in sales occurred in the $350,000 to $500,000 range.
A thriving local economy has been conducive to housing recovery. The most recent national unemployment rate is 4.7 percent, though it’s 3.6 percent locally. The Minneapolis–St. Paul metropolitan area has one of the lowest unemployment rates of any major metro area.
The average 30-year fixed mortgage rate stands at 4.17 percent, still well below a long-term average of about 8.0 percent. Marginally higher rates were widely expected in 2016, but the Federal Reserve waited until December. Expect about two minor increases in the federal funds rate in 2017—barring any unforeseen events. Job, wage and inventory growth are key to offsetting any declining affordability brought on by higher rates.
“The trick will be increasing supply enough to keep price growth at a moderate pace,” said Kath Hammerseng, MAAR President-Elect. “That will allow households to better absorb rising borrowing costs. Overall 2017 is expected to be another good year for housing.”
