Despite weather events that have brought frigid temperatures and heavy snow to large swaths of the U.S., residential real estate markets have performed better than anticipated so far this year. While a complete downturn in sales and prices was not at all expected, some softening was anticipated. Instead, pending sales are performing well in many markets, while new listings are not experiencing any negative swings of concern.
In the Twin Cities region, for the week ending February 2:
New Listings decreased 9.2% to 912
Pending Sales increased 4.4% to 834
Inventory increased 2.6% to 8,023
For the month of December:
Median Sales Price increased 4.0% to $258,000
Days on Market decreased 6.6% to 57
Percent of Original List Price Received decreased 0.2% to 96.9%
The unemployment rate rose to 4.0 percent last month, a seven-month high. This may prove to be a forgettable blip, as other economic indicators are showing continued strength in the job force, including 100 straight months of employment gains punctuated by the most hiring in 11 months. The construction sector had its best month of employment since last February. With the Fed holding off on further interest rate increases, 2019 is beginning favorably for residential real estate.
In the Twin Cities region, for the week ending January 26:
New Listings increased 6.1% to 938
Pending Sales increased 5.5% to 783
Inventory increased 2.9% to 8,100
For the month of December:
Median Sales Price increased 4.0% to $258,000
Days on Market decreased 6.6% to 57
Percent of Original List Price Received decreased 0.2% to 96.9%
2018 ANNUAL WRAP-UP
Beauty is in the eye of the beholder. Sometimes, so are market statistics. For sellers, the big stories of 2018 were three records: prices, market times and percent of list price received at sale. For buyers, the major themes were increased new listings toward year-end, an annual inventory increase, changing interest rates and affordability pressure. Driven by sizable gains in new listings later in 2018 combined with moderating sales, for-sale housing supply finally bounced off its 15-year low. The ongoing housing shortage has created a competitive environment where multiple offers have become common. Thus, sellers are receiving strong offers in record time, but this fast-paced market can frustrate some consumers. Market times continued to shrink while absorption rates remained tight but showed signs of easing. Mortgage rates on a 30-year fixed loan started the year around 4.0 percent but touched 5.0 percent before settling on 4.5 percent. Foreclosure activity fell for a seventh straight year and is back around 2005 levels. Although single-family homes made up about 74.0 percent of all sales, both townhomes and condos had better sales performances. Similarly, previously-owned homes made up about 91.0 percent of sales but new construction showed a much stronger gain.
2018 BY THE NUMBERS
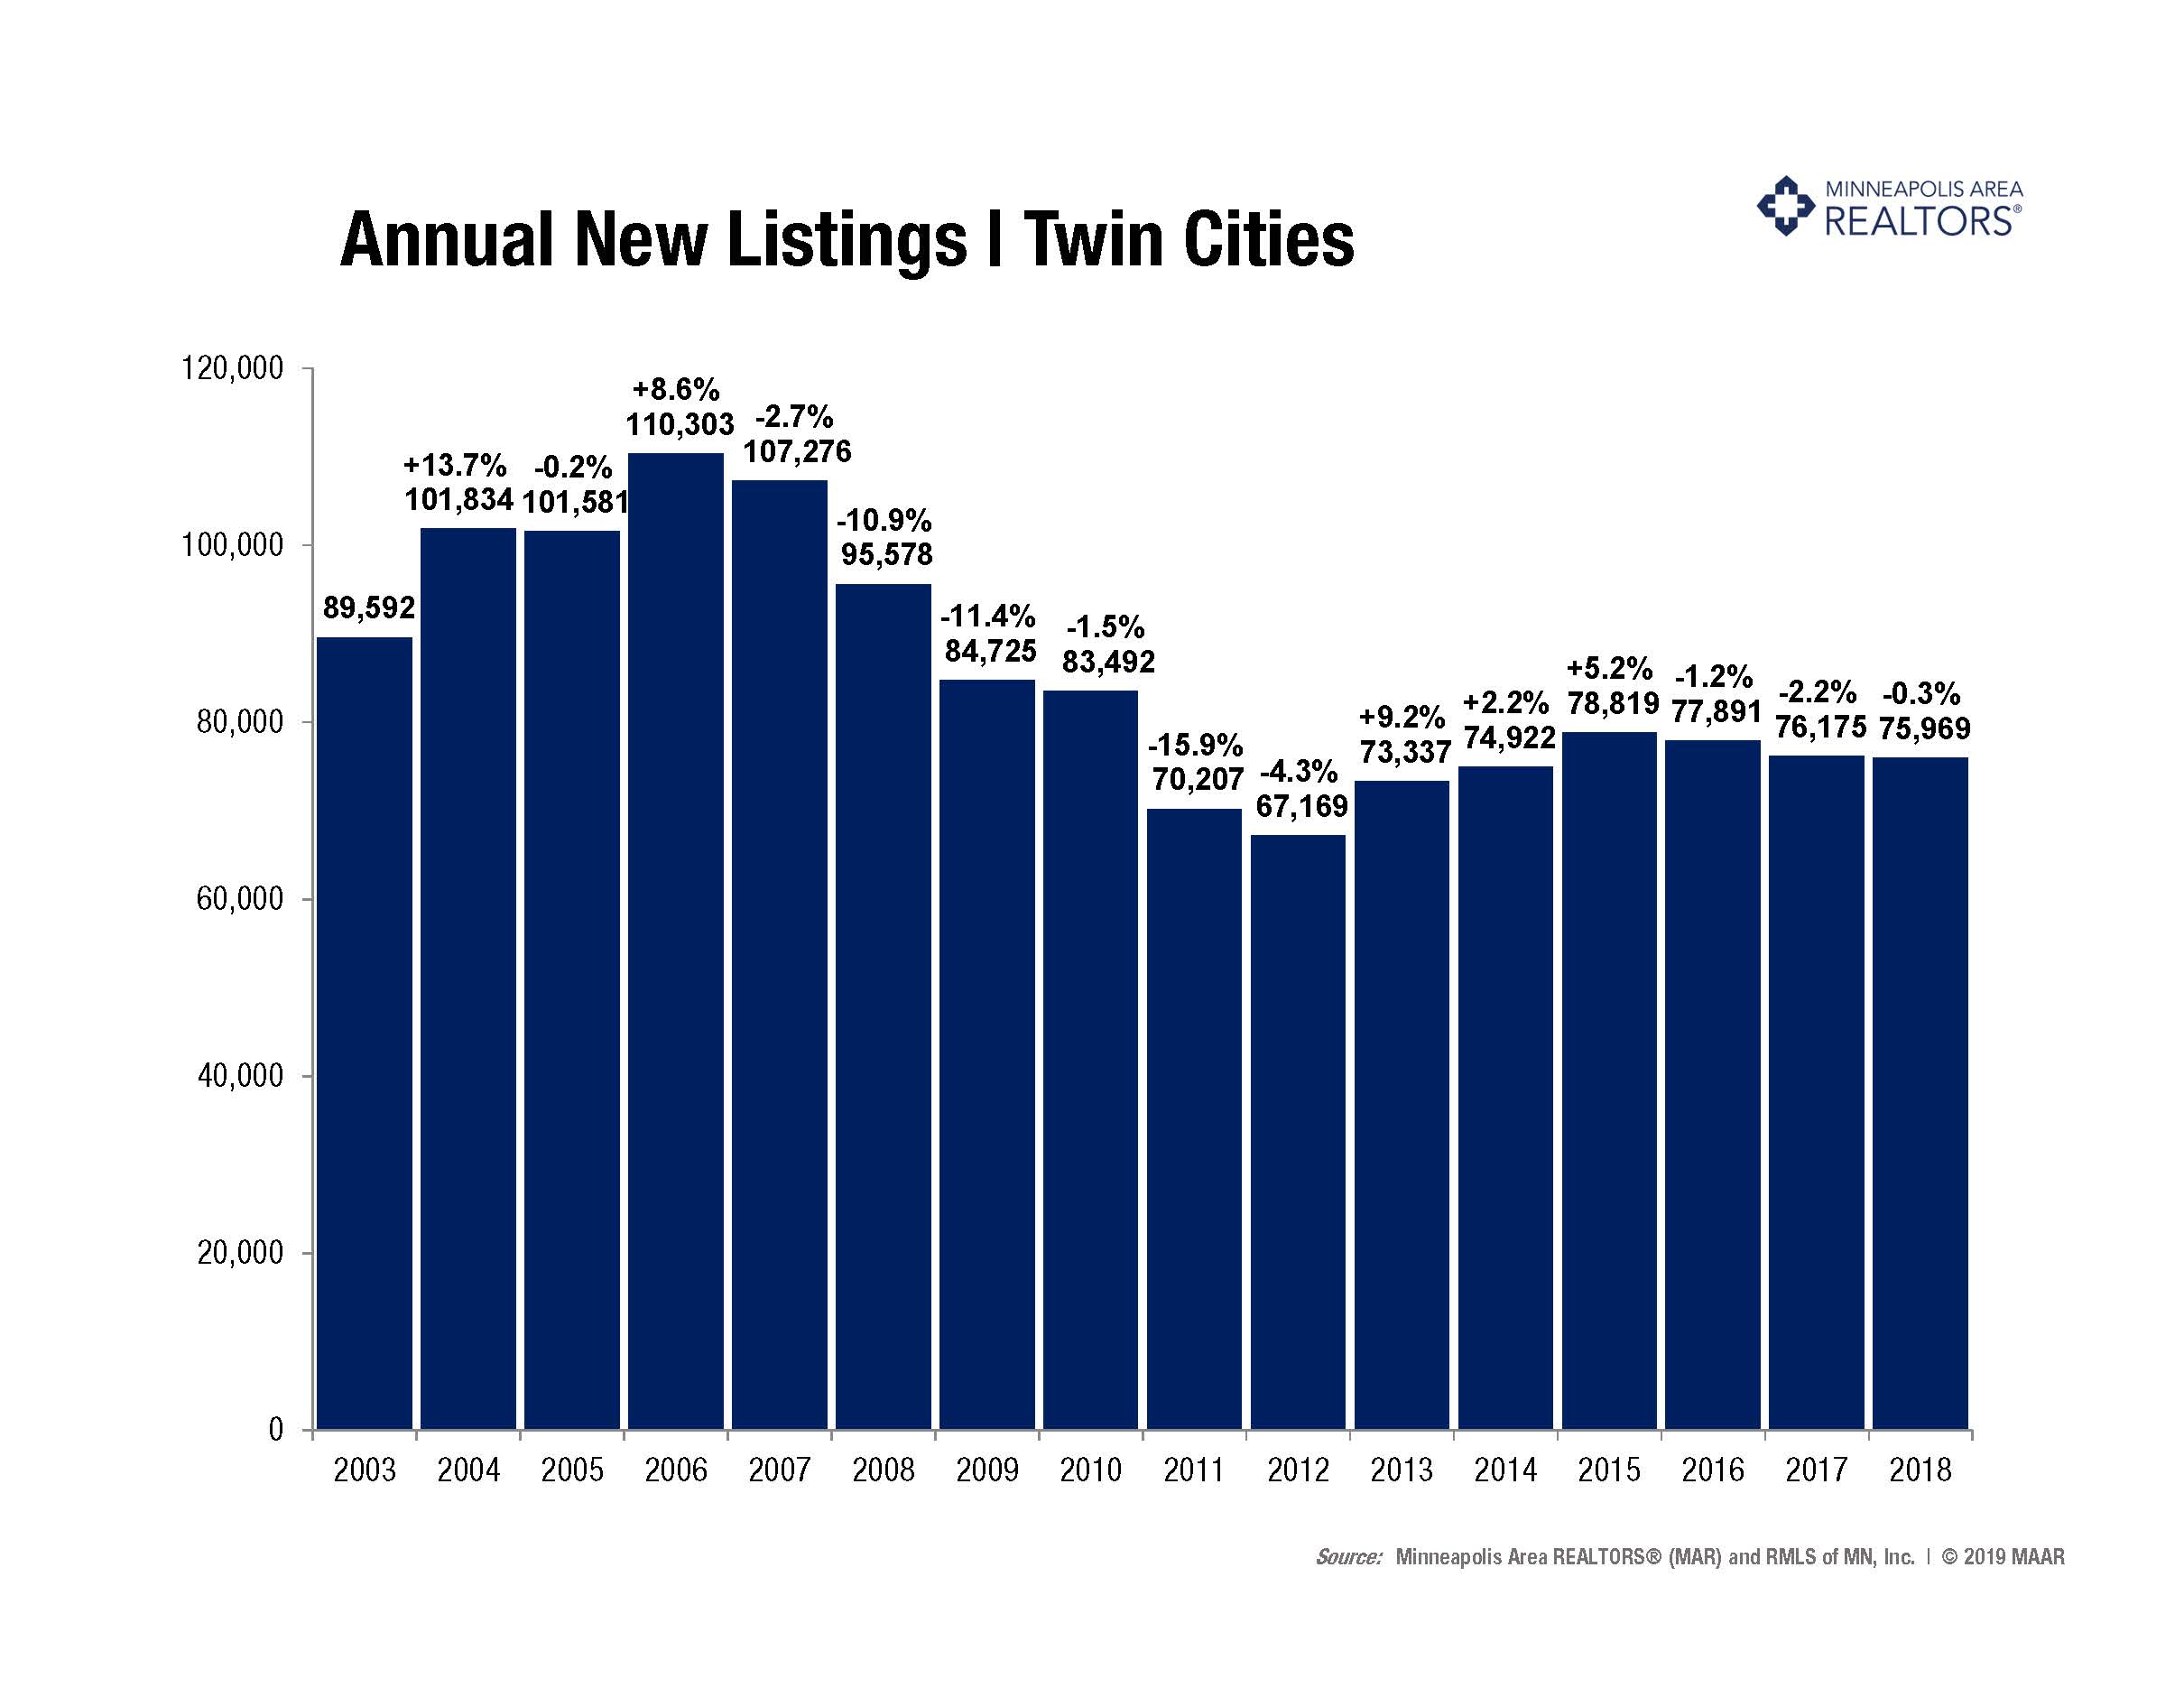
– Sellers listed 75,969 properties on the market, a 0.3 percent decrease from 2017
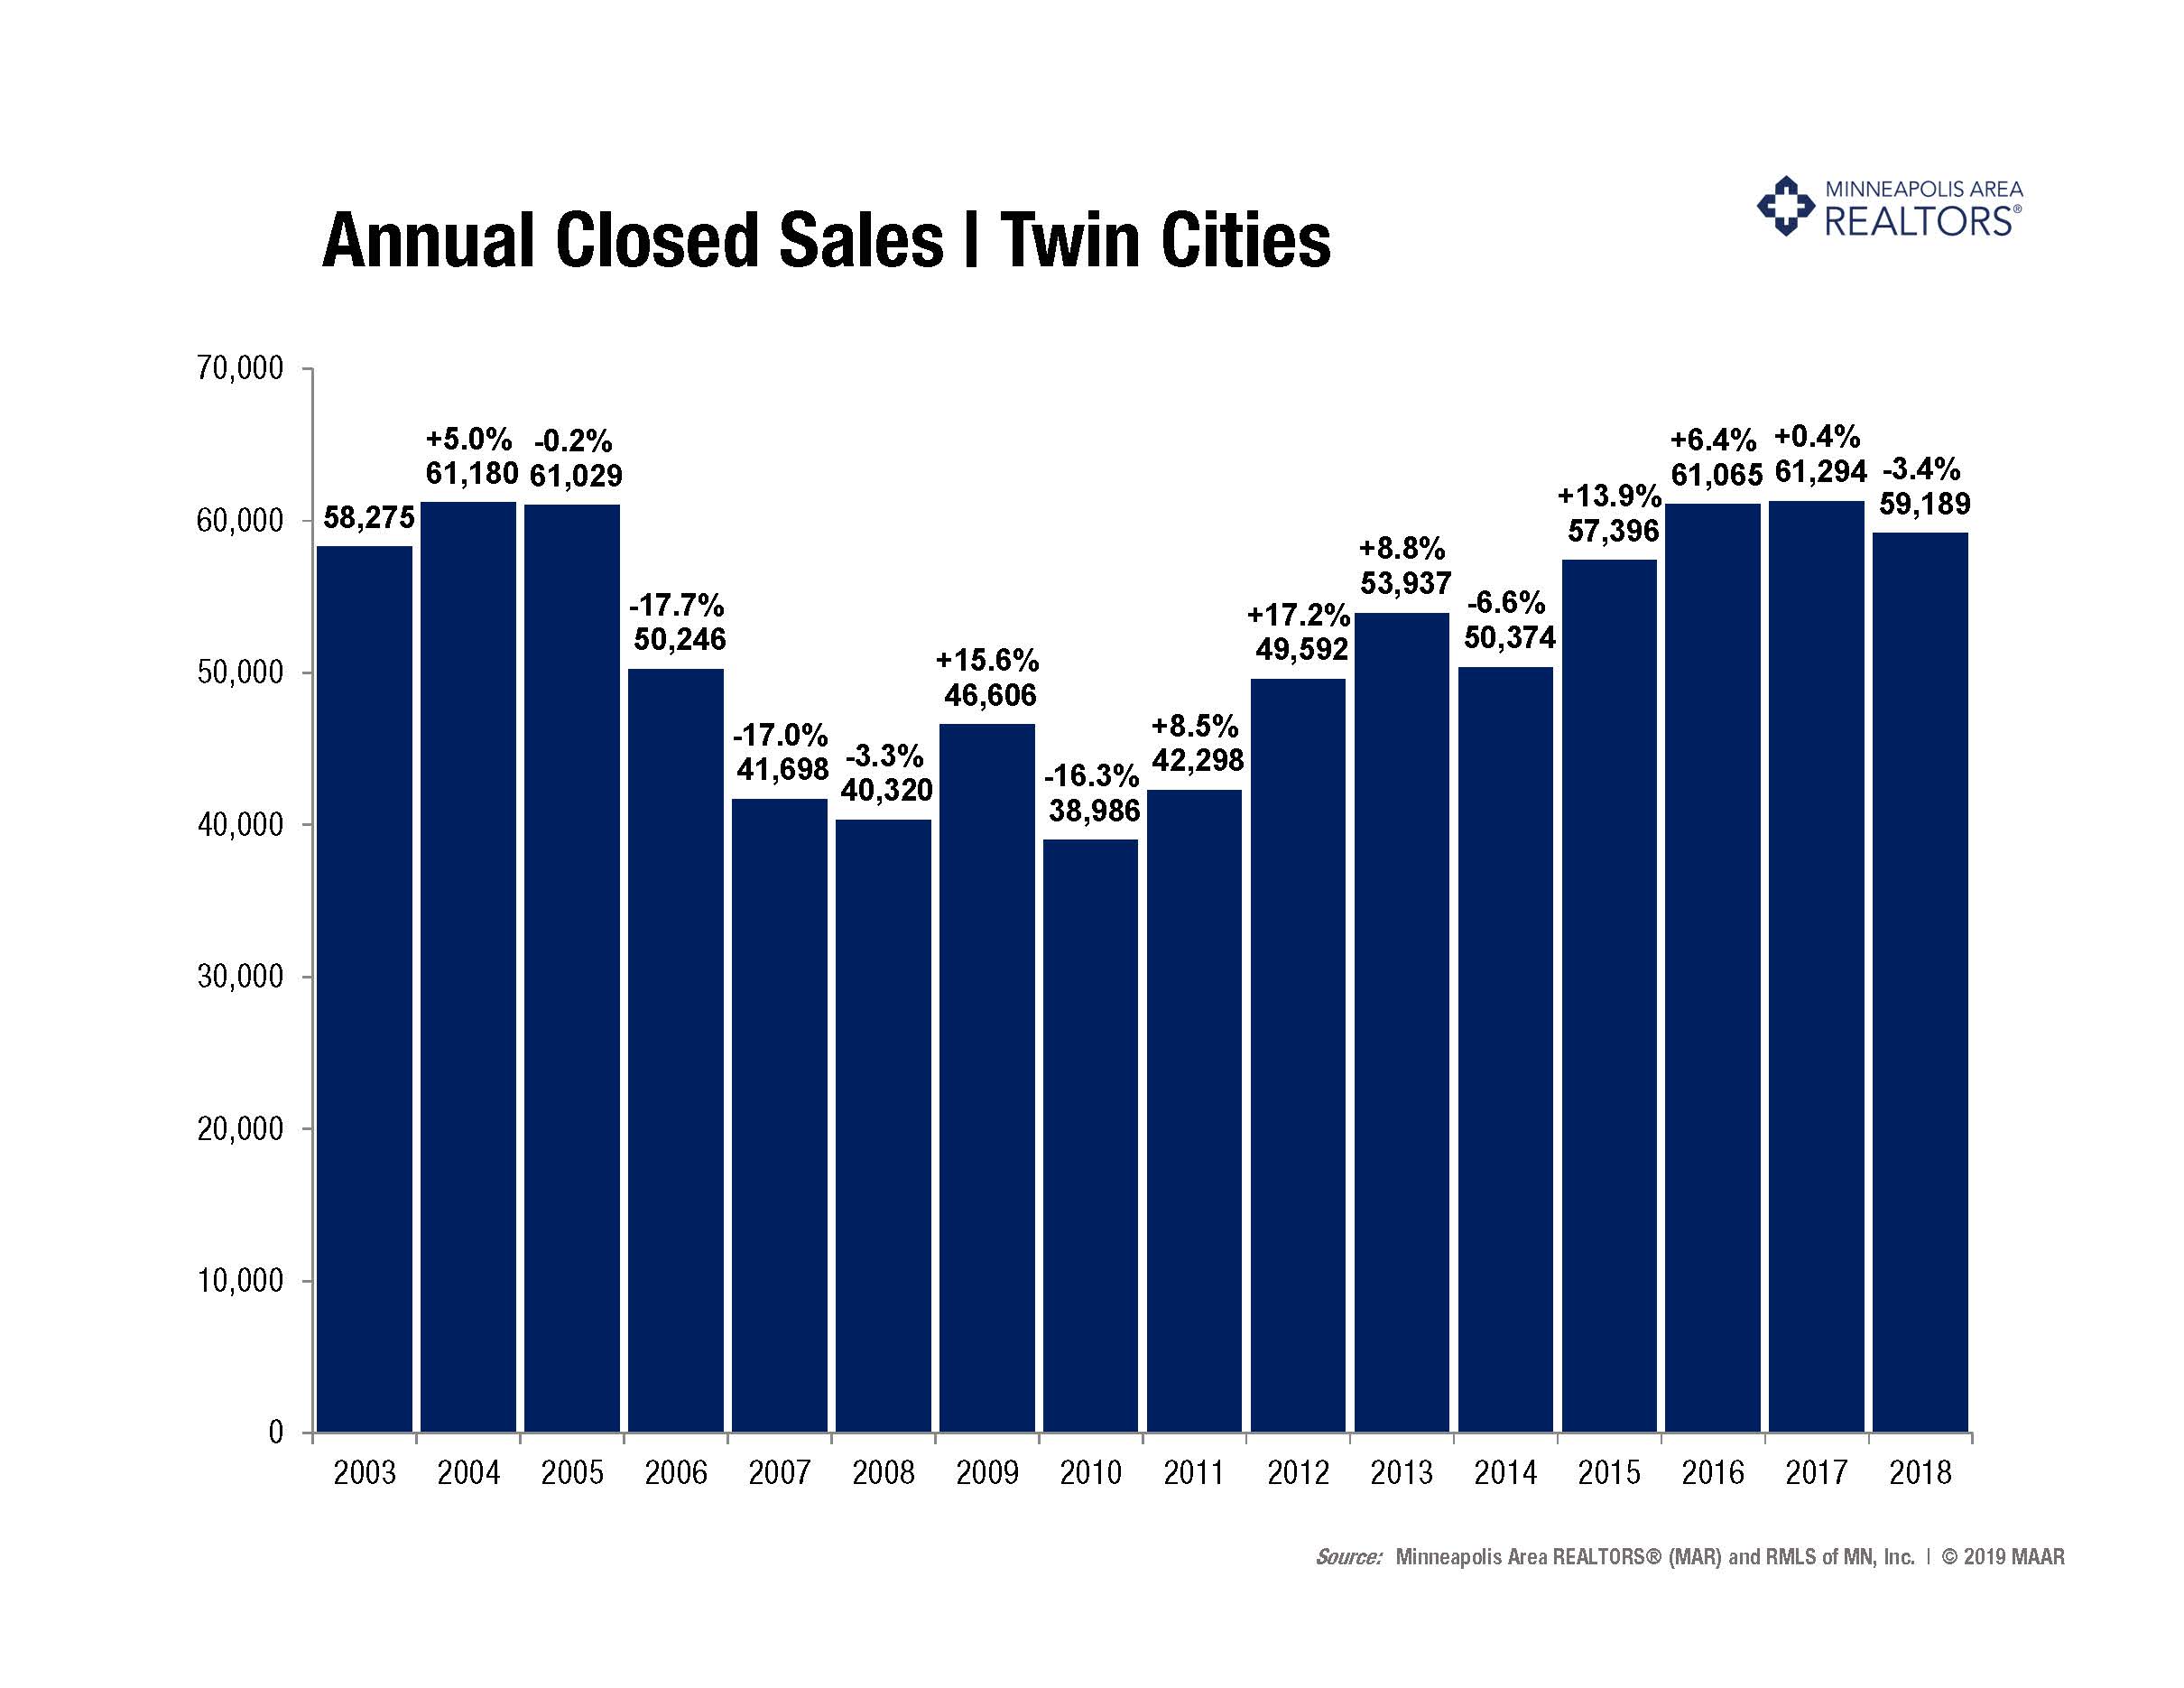
– Buyers closed on 59,189 homes, a 3.4 percent decrease from 2017 yet the 4th highest figure since 2003
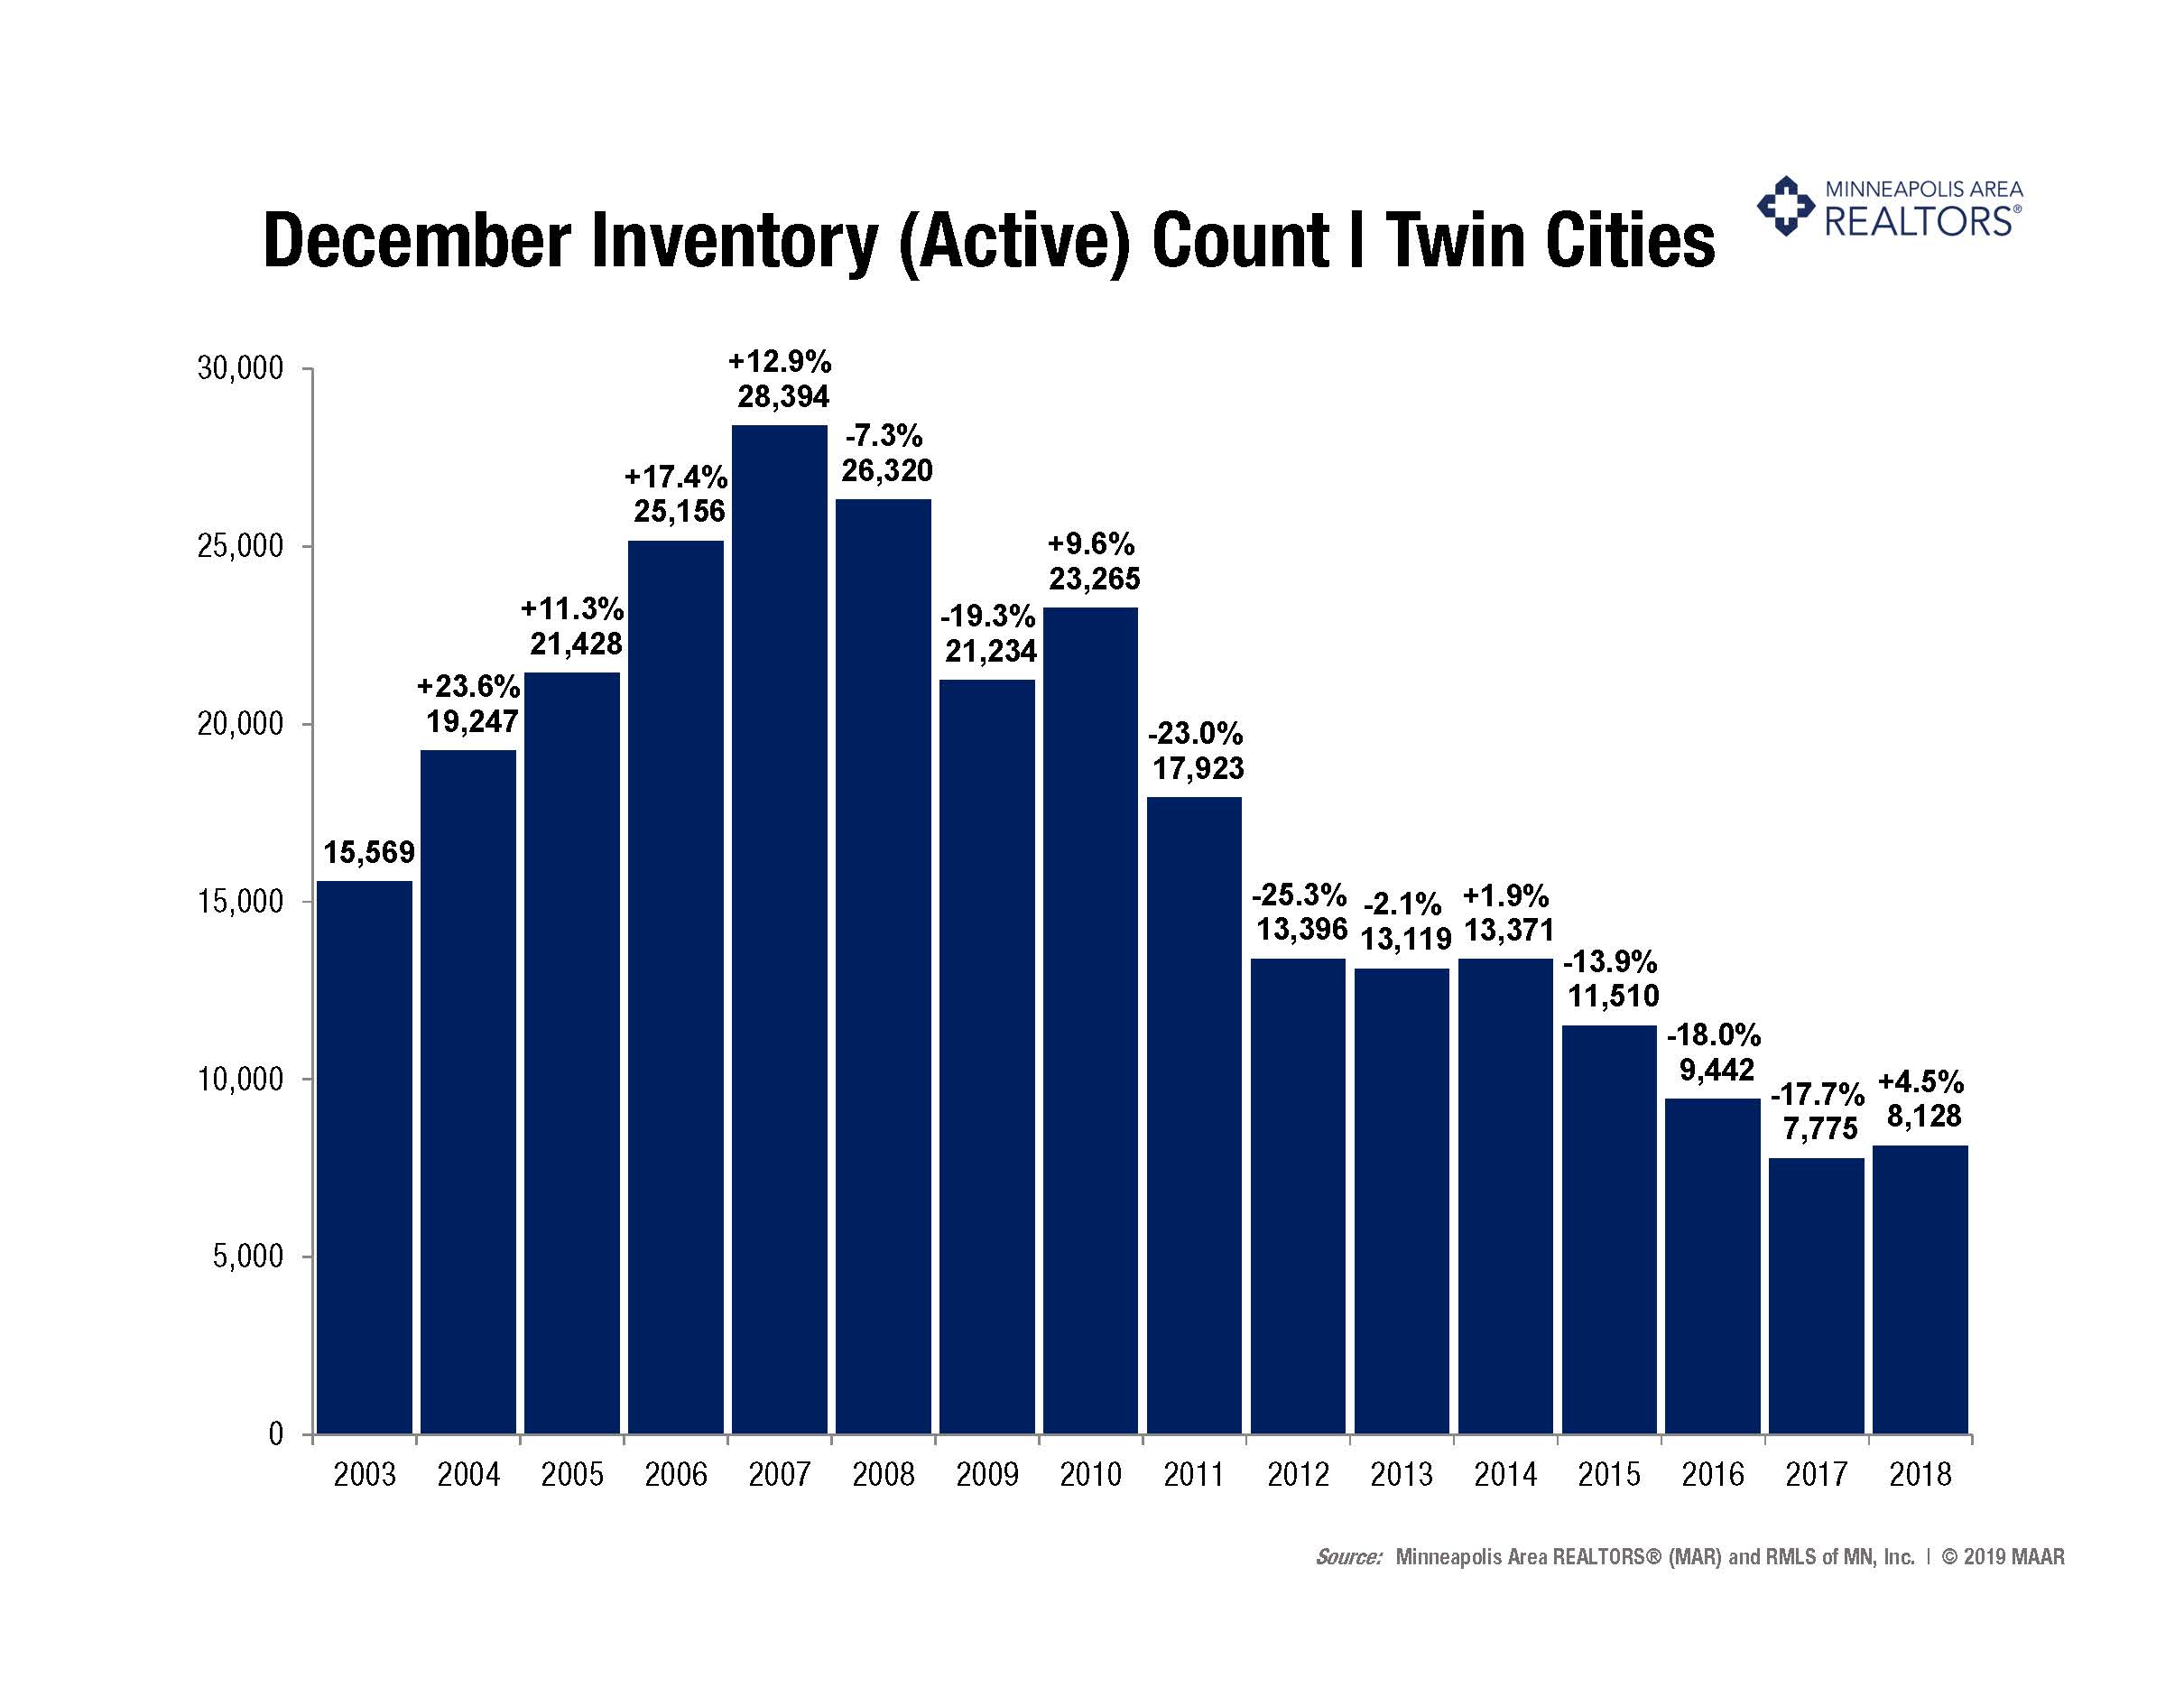
– Inventory levels for December rose 4.5 percent compared to 2017 to 8,128 units, reversing 3 years of declines
–Months Supply of Inventory was up 8.5 percent to 1.7 months, also the first increase since 2014
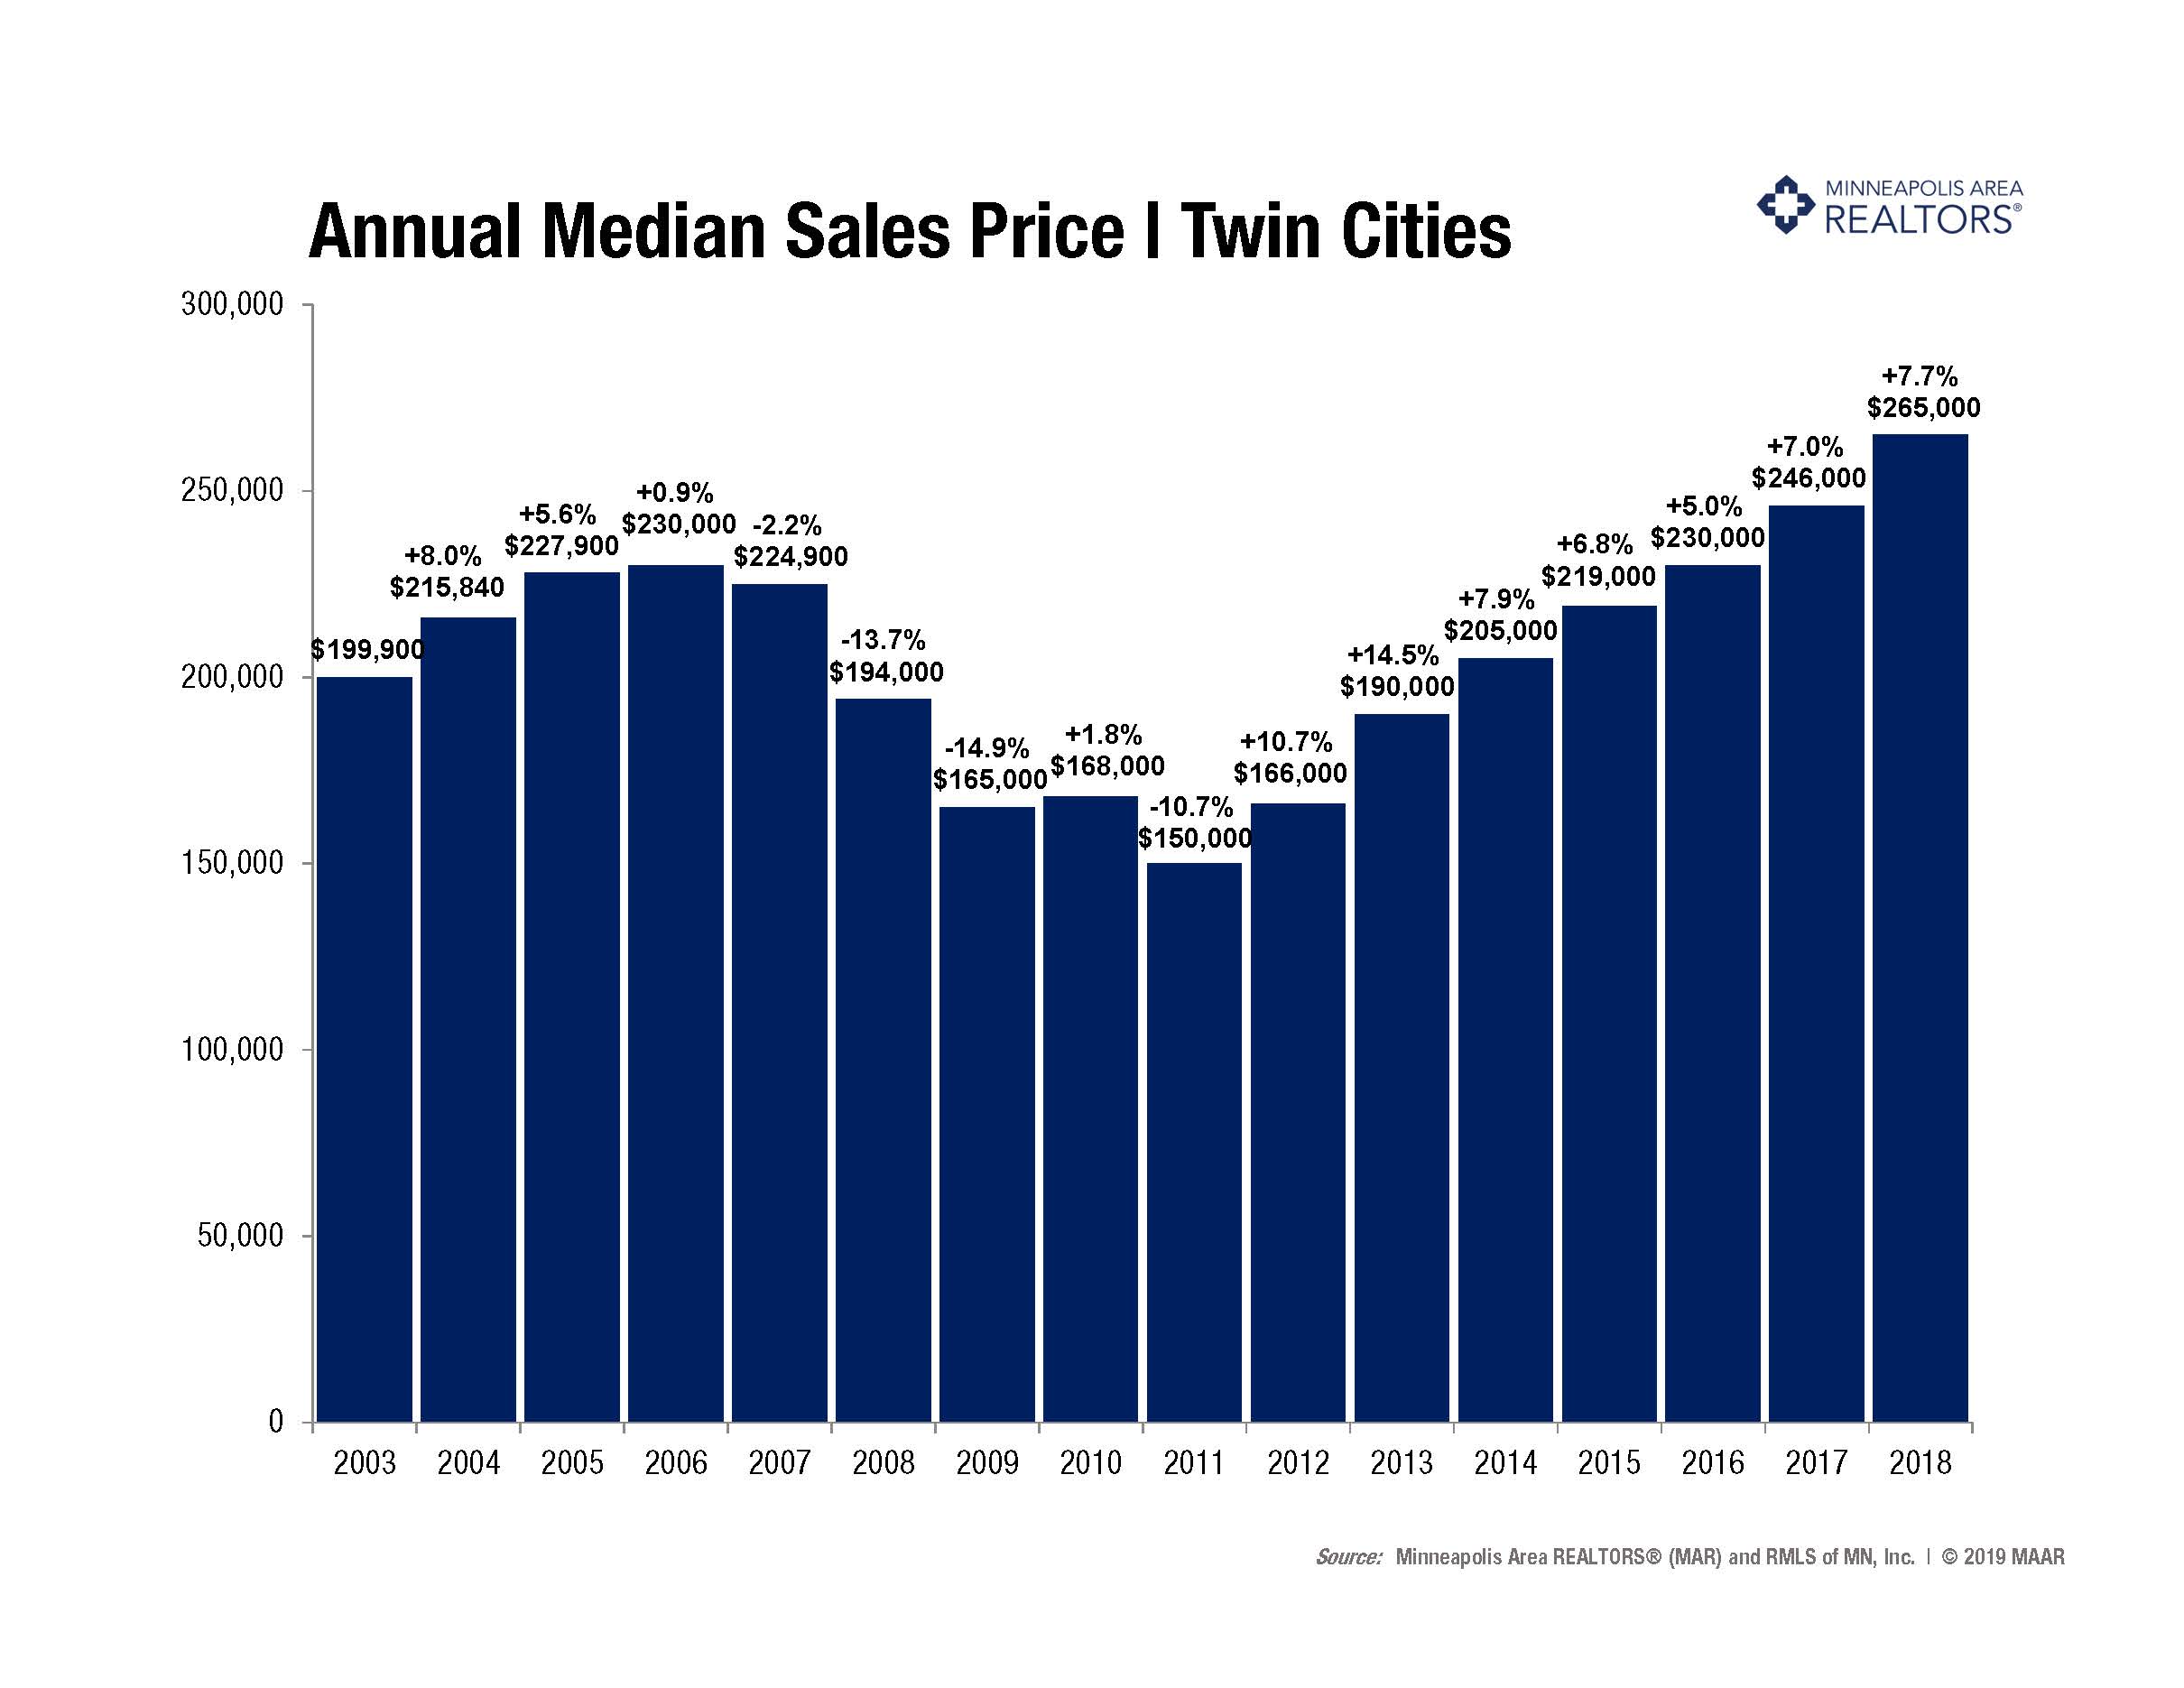
-The Median Sales Price rose 7.7 percent to $265,000, an all-time record high
-Cumulative Days on Market declined 14.3 percent to 48 days, on average (median of 22)—a 12-year record low
–Changes in sales activity varied by market segment
– Single-family sales decreased 4.2 percent; condo sales rose 5.4 percent; townhome sales fell 3.3 percent
–Traditional sales declined 2.0 percent; foreclosure sales fell 38.0 percent; short sales were down 36.2 percent
–Previously-owned sales decreased 4.7 percent; new construction sales rose 12.7 percent
POIGNANT QUOTABLES
“The year definitely had some ups and downs. Beyond record prices and lower-but-still-strong sales, inventory finally turned around while some affordability concerns persisted. Our region is extremely high-performing when it comes to homeownership, employment, income, education, civic engagement and quality of life. Despite some manageable headwinds, homeownership and real estate is still a compelling investment for Minnesota,” said Todd Urbanski, President of the Minneapolis Area REALTORS®.
“Last year homebuyers became more selective even as market times shrank. Working with a REALTOR® was key as inventory was often limited,” said Patti Jo Fitzpatrick, President of the Saint Paul Area Association of REALTORS®. “We still saw some challenges around inventory and downsizing. We anticipate more balance this year as inventory eases. It’ll be interesting to see how things play out.”
CHARTING THE MARKET
Sellers posted a third consecutive decrease in activity but showed signs of turnaround, particularly in the second half of 2018. New listings were down just 0.3% compared to 2017. Many sellers are enjoying rising prices and quick market times but are waiting for more inventory choices before listing. Listings tend to stand out more in a tight inventory market versus one with growing supply.
Buyers were active in 2018, though 3.4% less so than in 2017. Closed sales remain strong. 2018 saw the 4th highest unit sales since 2003. Buyers were encouraged by low interest rates while some were spooked by rate hikes. Rising rents, a solid economy, upper bracket activity, as well as condos and new construction helped to finish off the year strong, despite a modest decrease.
With low-but-rising supply combined with high-but-moderating sales, it’s no surprise the median sales price rose 7.7% to $265,000. This marks a record high. Home prices have risen 76.7% from their low point in 2011 and 15.2% from their prior 2006 peak. Rising prices boost equity, motivate reluctant sellers and replenish local tax base, but can also cause affordability challenges.
Inventory levels finally rose 4.5% after reaching a 15-year low in 2017. Buyers had 8,128 options in December but over 13,000 in September. When combined with strong demand, this supply-side constraint has resulted in competitive bidding and rising prices. The shortage has frustrated some buyers—particularly at the entry-level price points. More supply is vital to ongoing market health and to increase housing opportunities.
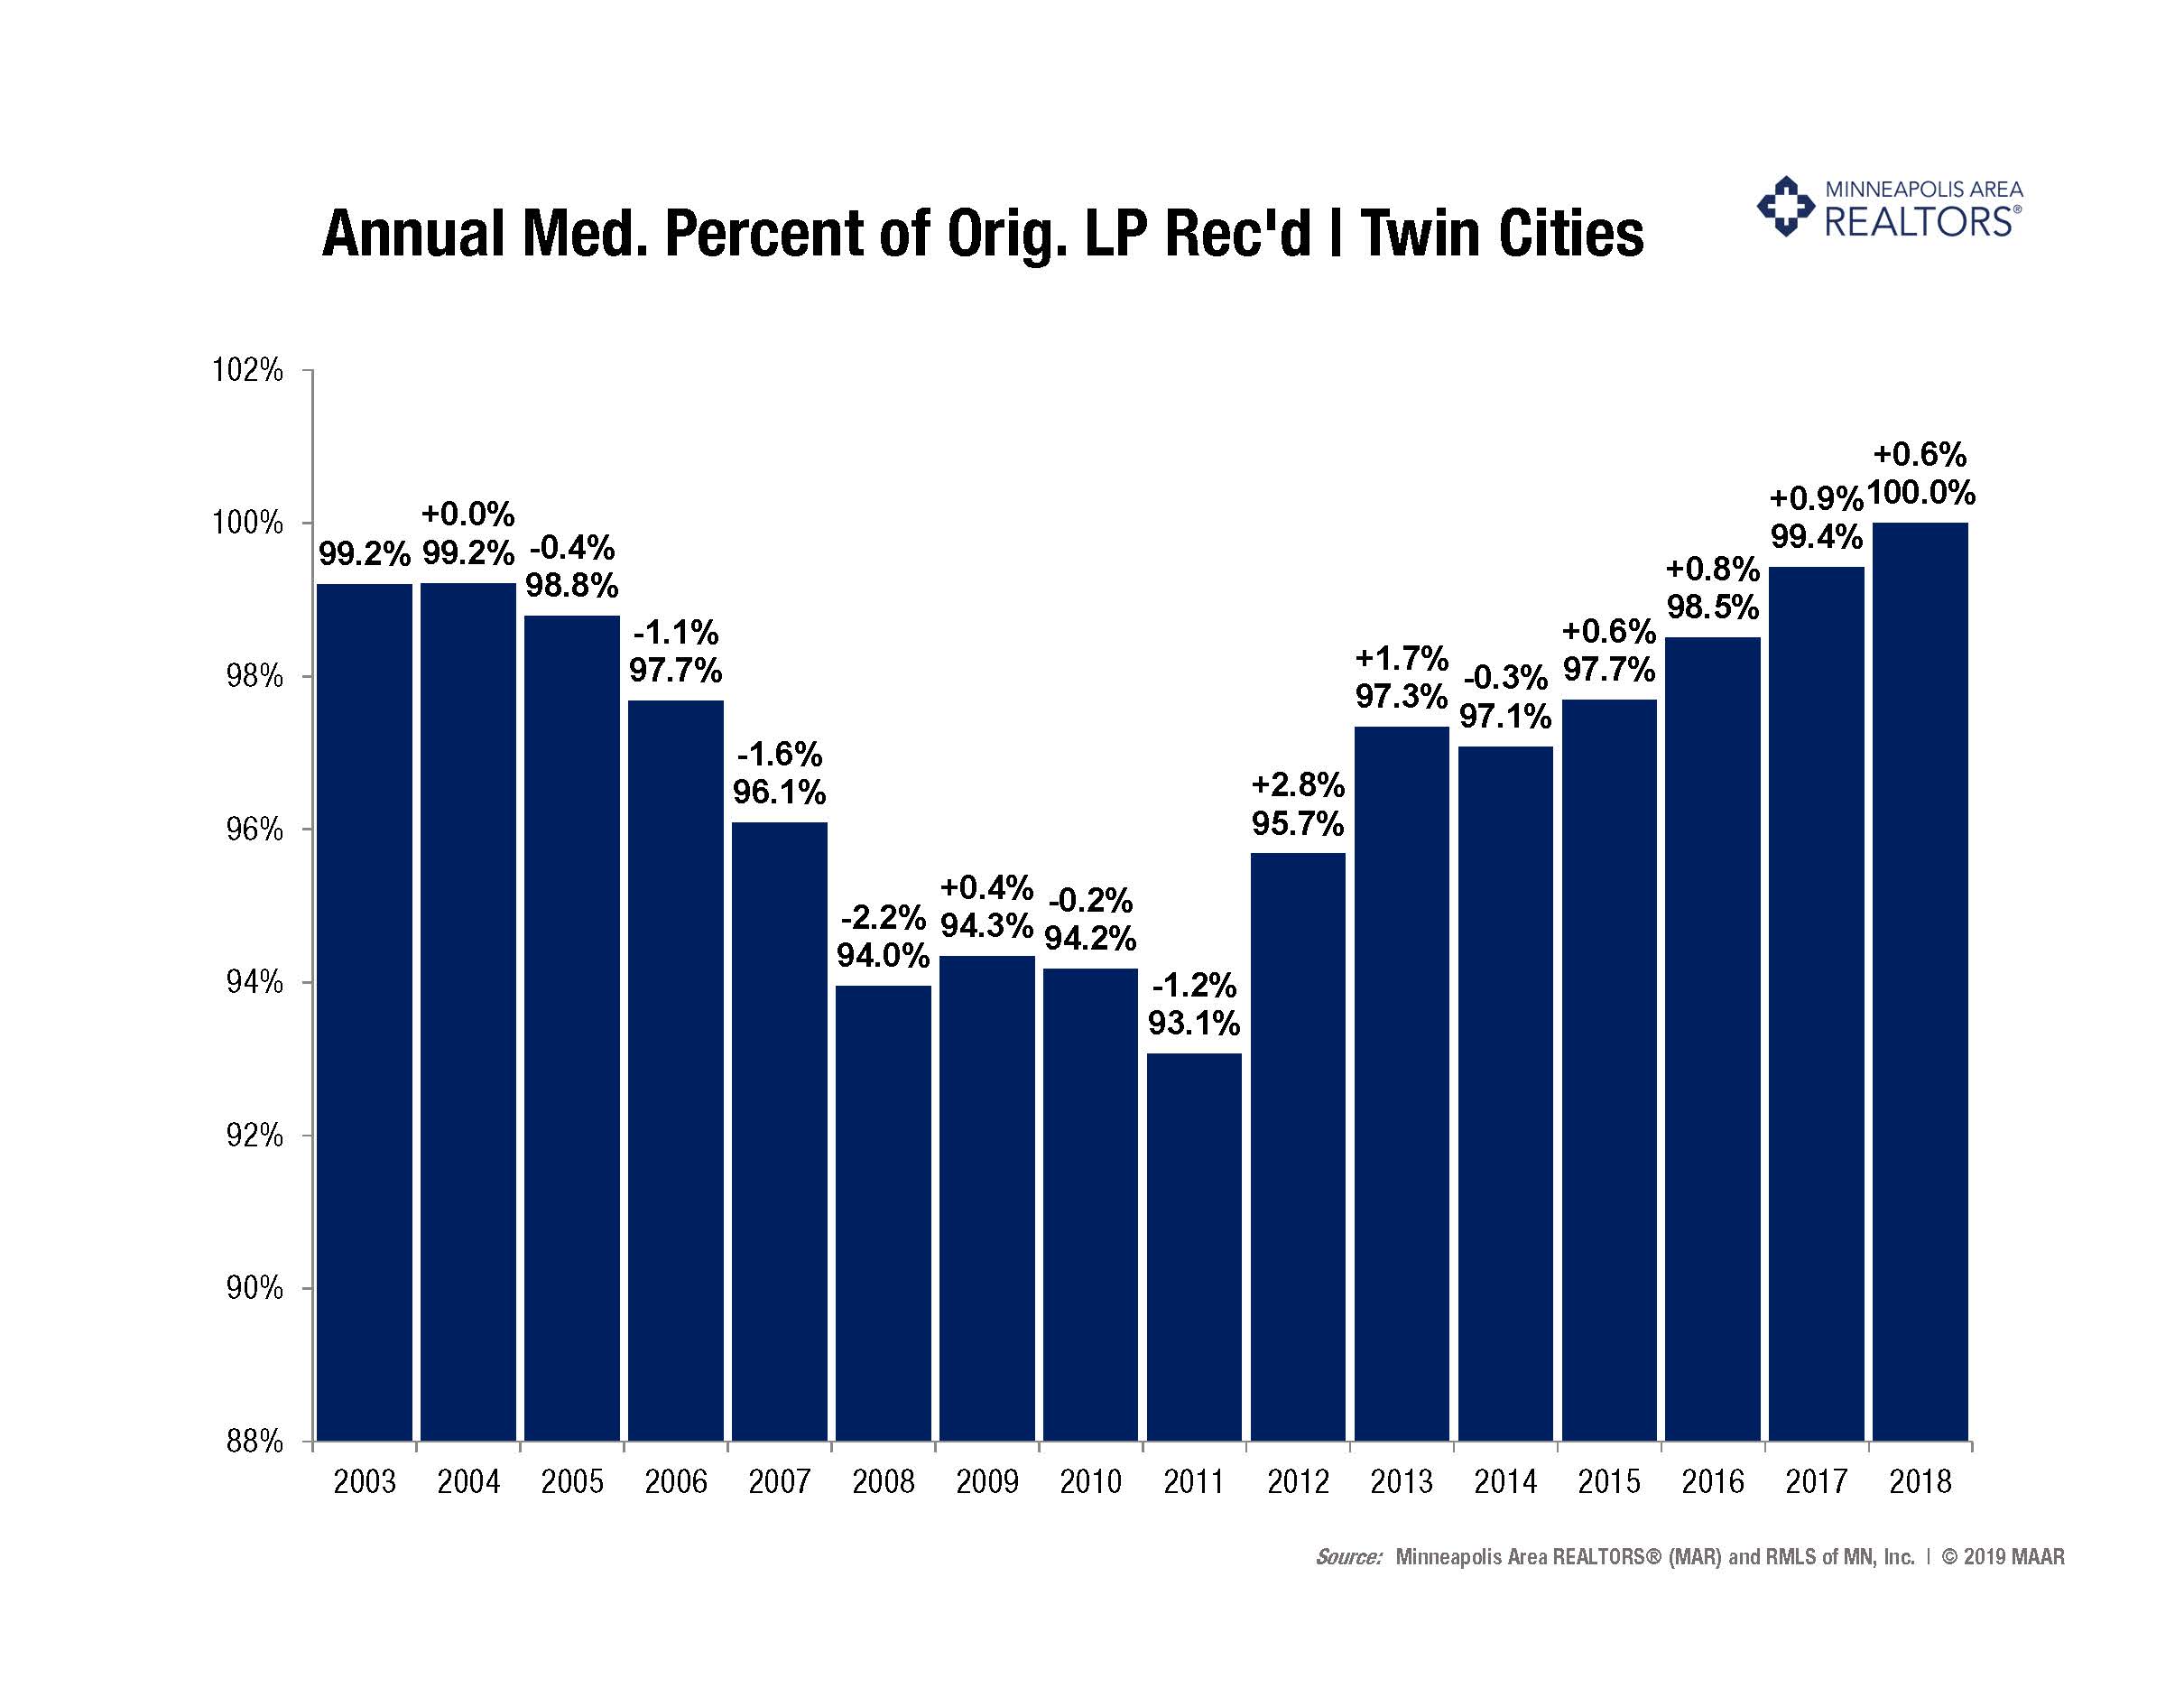
Mostly due to fundamentals but also better pricing decisions, sellers yielded a higher share of their asking price. The median percent of original list price received reached a record high of 100.0 percent. Sellers had a 50/50 chance of receiving more than their original list price. The climate for sellers has improved immensely but that could be changing. Sellers are seeing good offers in record time, for now.
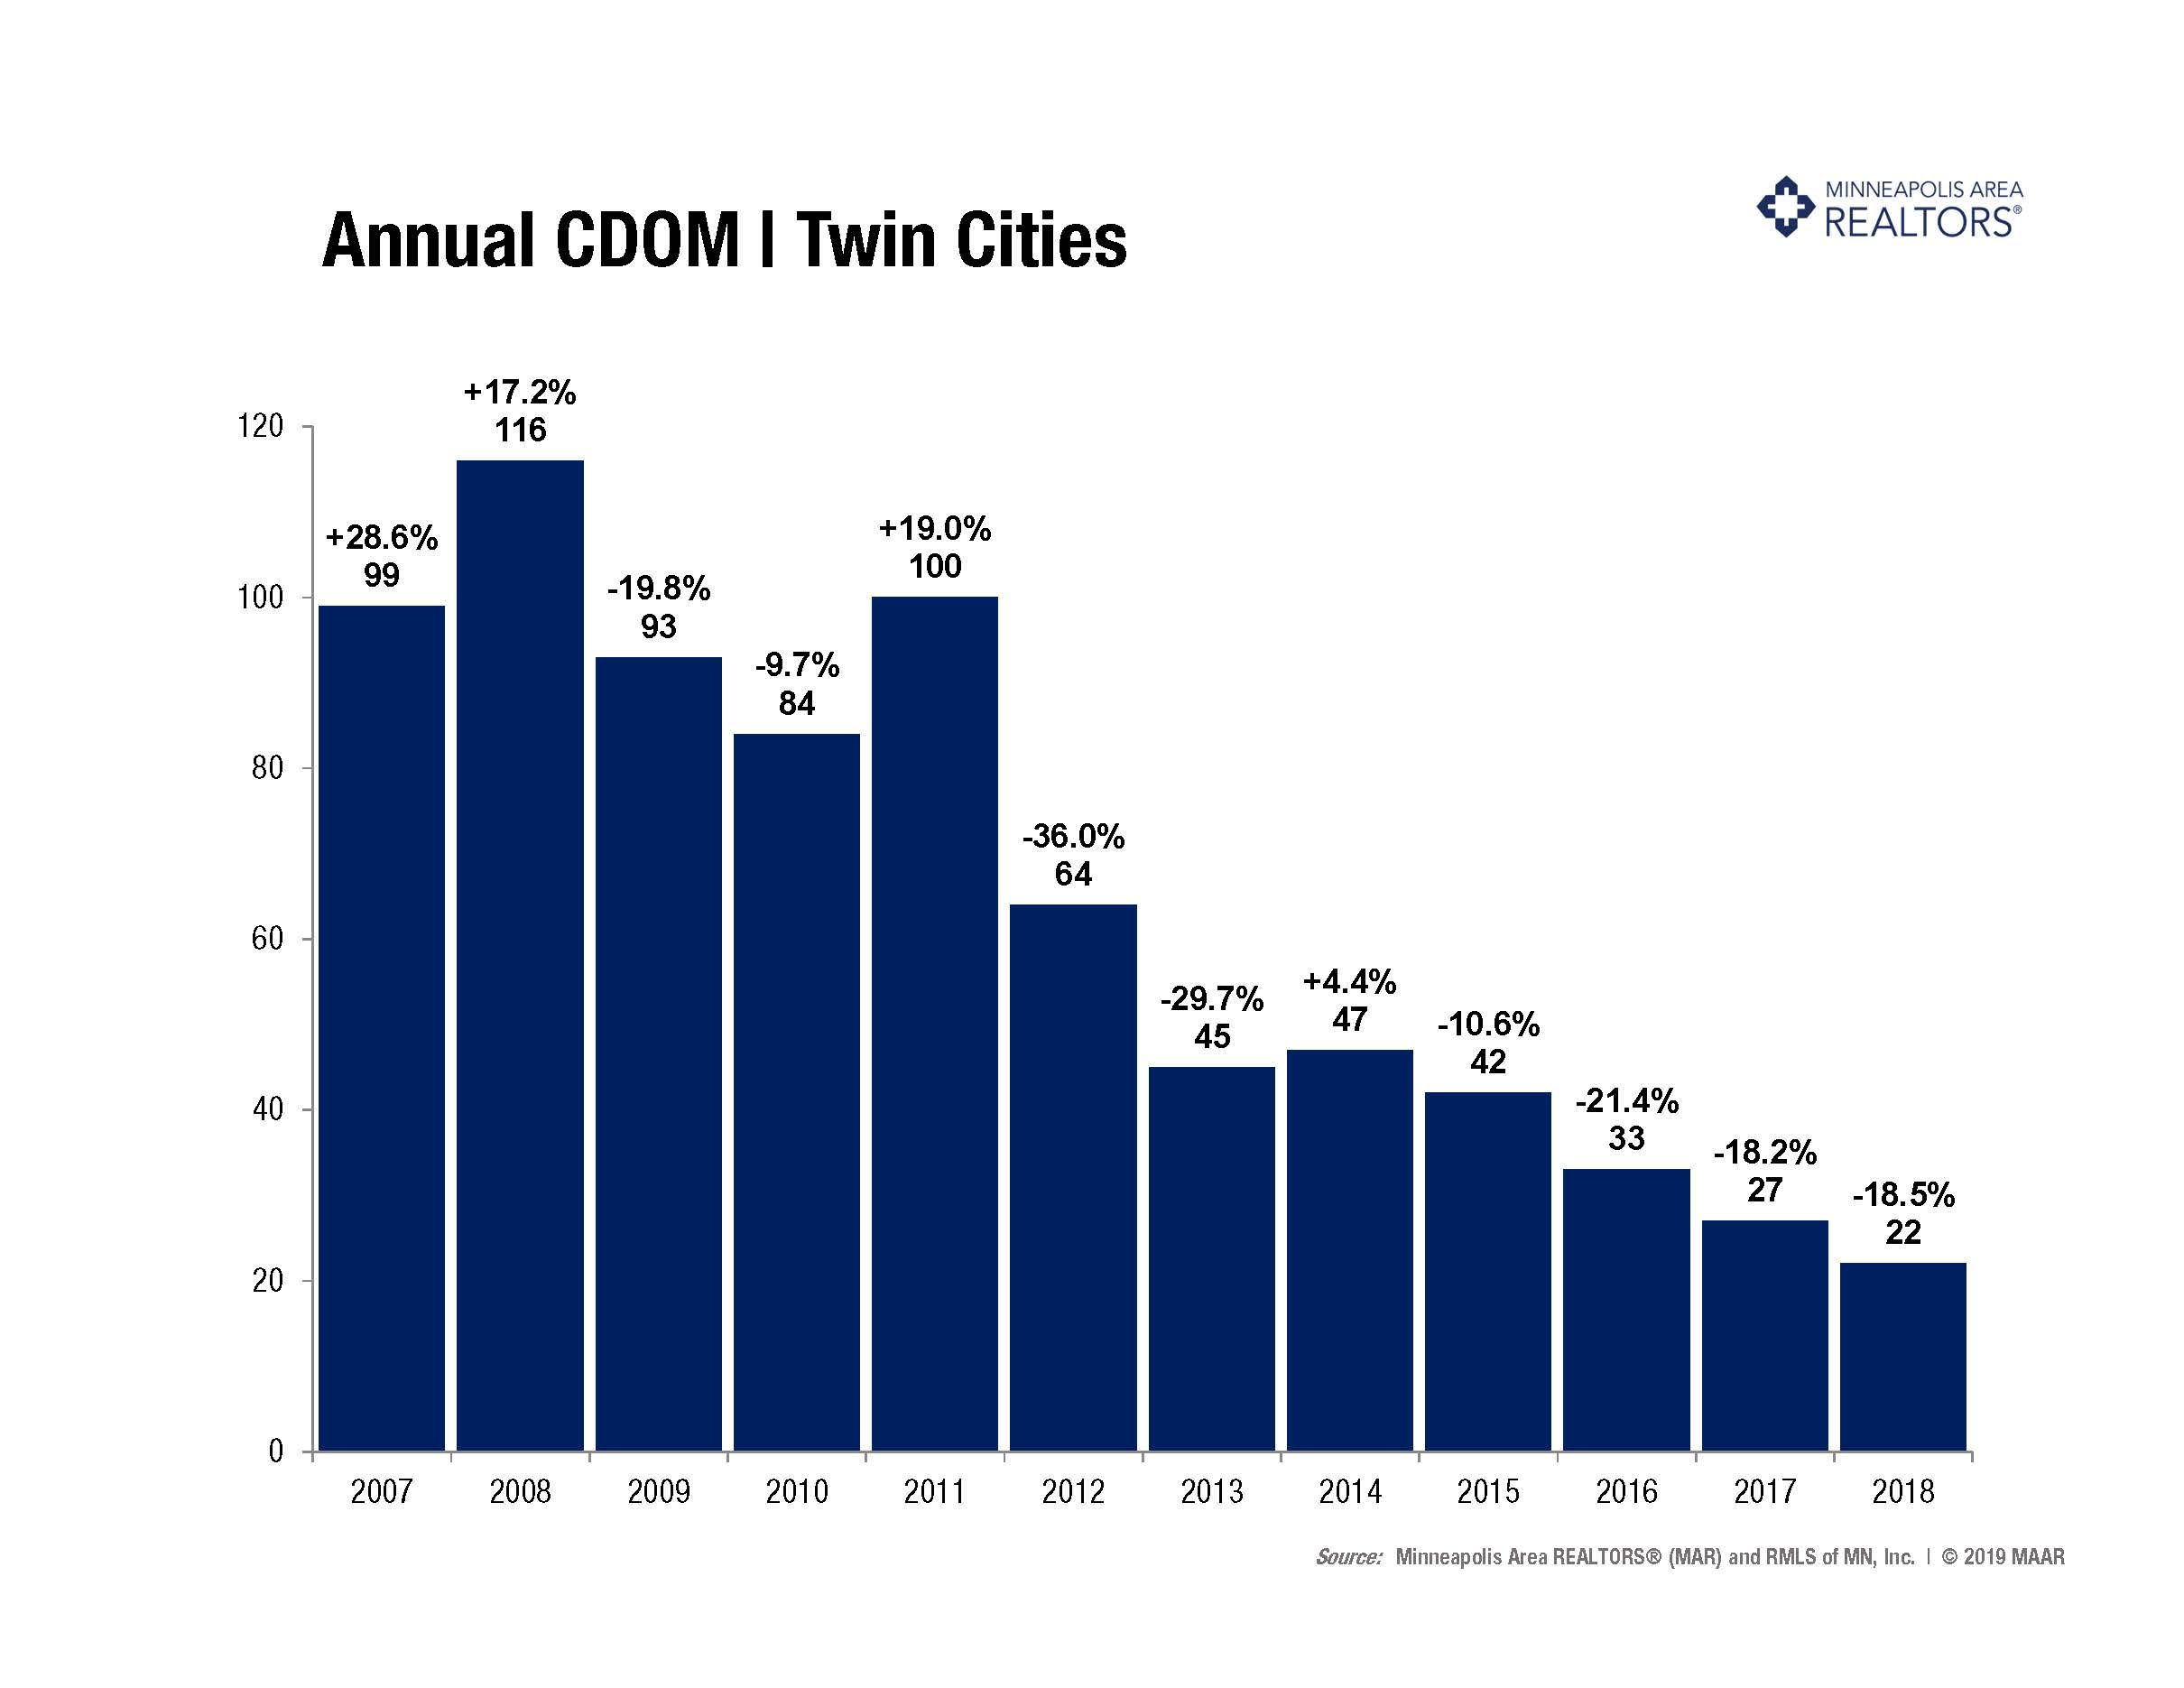
Homes are selling at a 12-year record pace. Listings spent a median of 22 days on market, 18.5 percent fewer than 2017 (avg. of 48). That is nearly half the market time of 2015 and under a quarter of the market time from 2011. Among other trends, relatively strong sales of homes selling in record time and at record prices has motivated some sellers. But these market dynamics won’t last forever.
Although snow and cold have been affecting a sizable portion of the nation this January, the initial assessment of early-year weekly real estate trends indicates a healthy level of new listings in many housing markets – even in wintry locales. Pending sales figures are generally showing a healthy balance compared to last year at this time. Combined with favorable mortgage rates, these early indicators bode well for active real estate markets across the nation. Let’s look at what happened locally.
In the Twin Cities region, for the week ending January 19:
New Listings increased 9.0% to 1,029
Pending Sales decreased 7.2% to 695
Inventory increased 2.1% to 8,029
For the month of December:
Median Sales Price increased 4.0% to $258,000
Days on Market decreased 6.6% to 57
Percent of Original List Price Received decreased 0.2% to 96.9%