Monday, June 8th, 2015

For Week Ending May 30, 2015

As we get closer to the official calendar launch of summer, residential real estate is taking off. The market may seem slower than in past spring/summer sprints, but numbers are by no means dismal. Whether the buyer category is dominated by Millennial, Generation X or move-up buyers from previous generations is no matter; activity is happening.

In the Twin Cities region, for the week ending May 30:

  • New Listings decreased 2.9% to 1,696
  • Pending Sales increased 23.5% to 1,357
  • Inventory decreased 4.6% to 16,202

For the month of May:

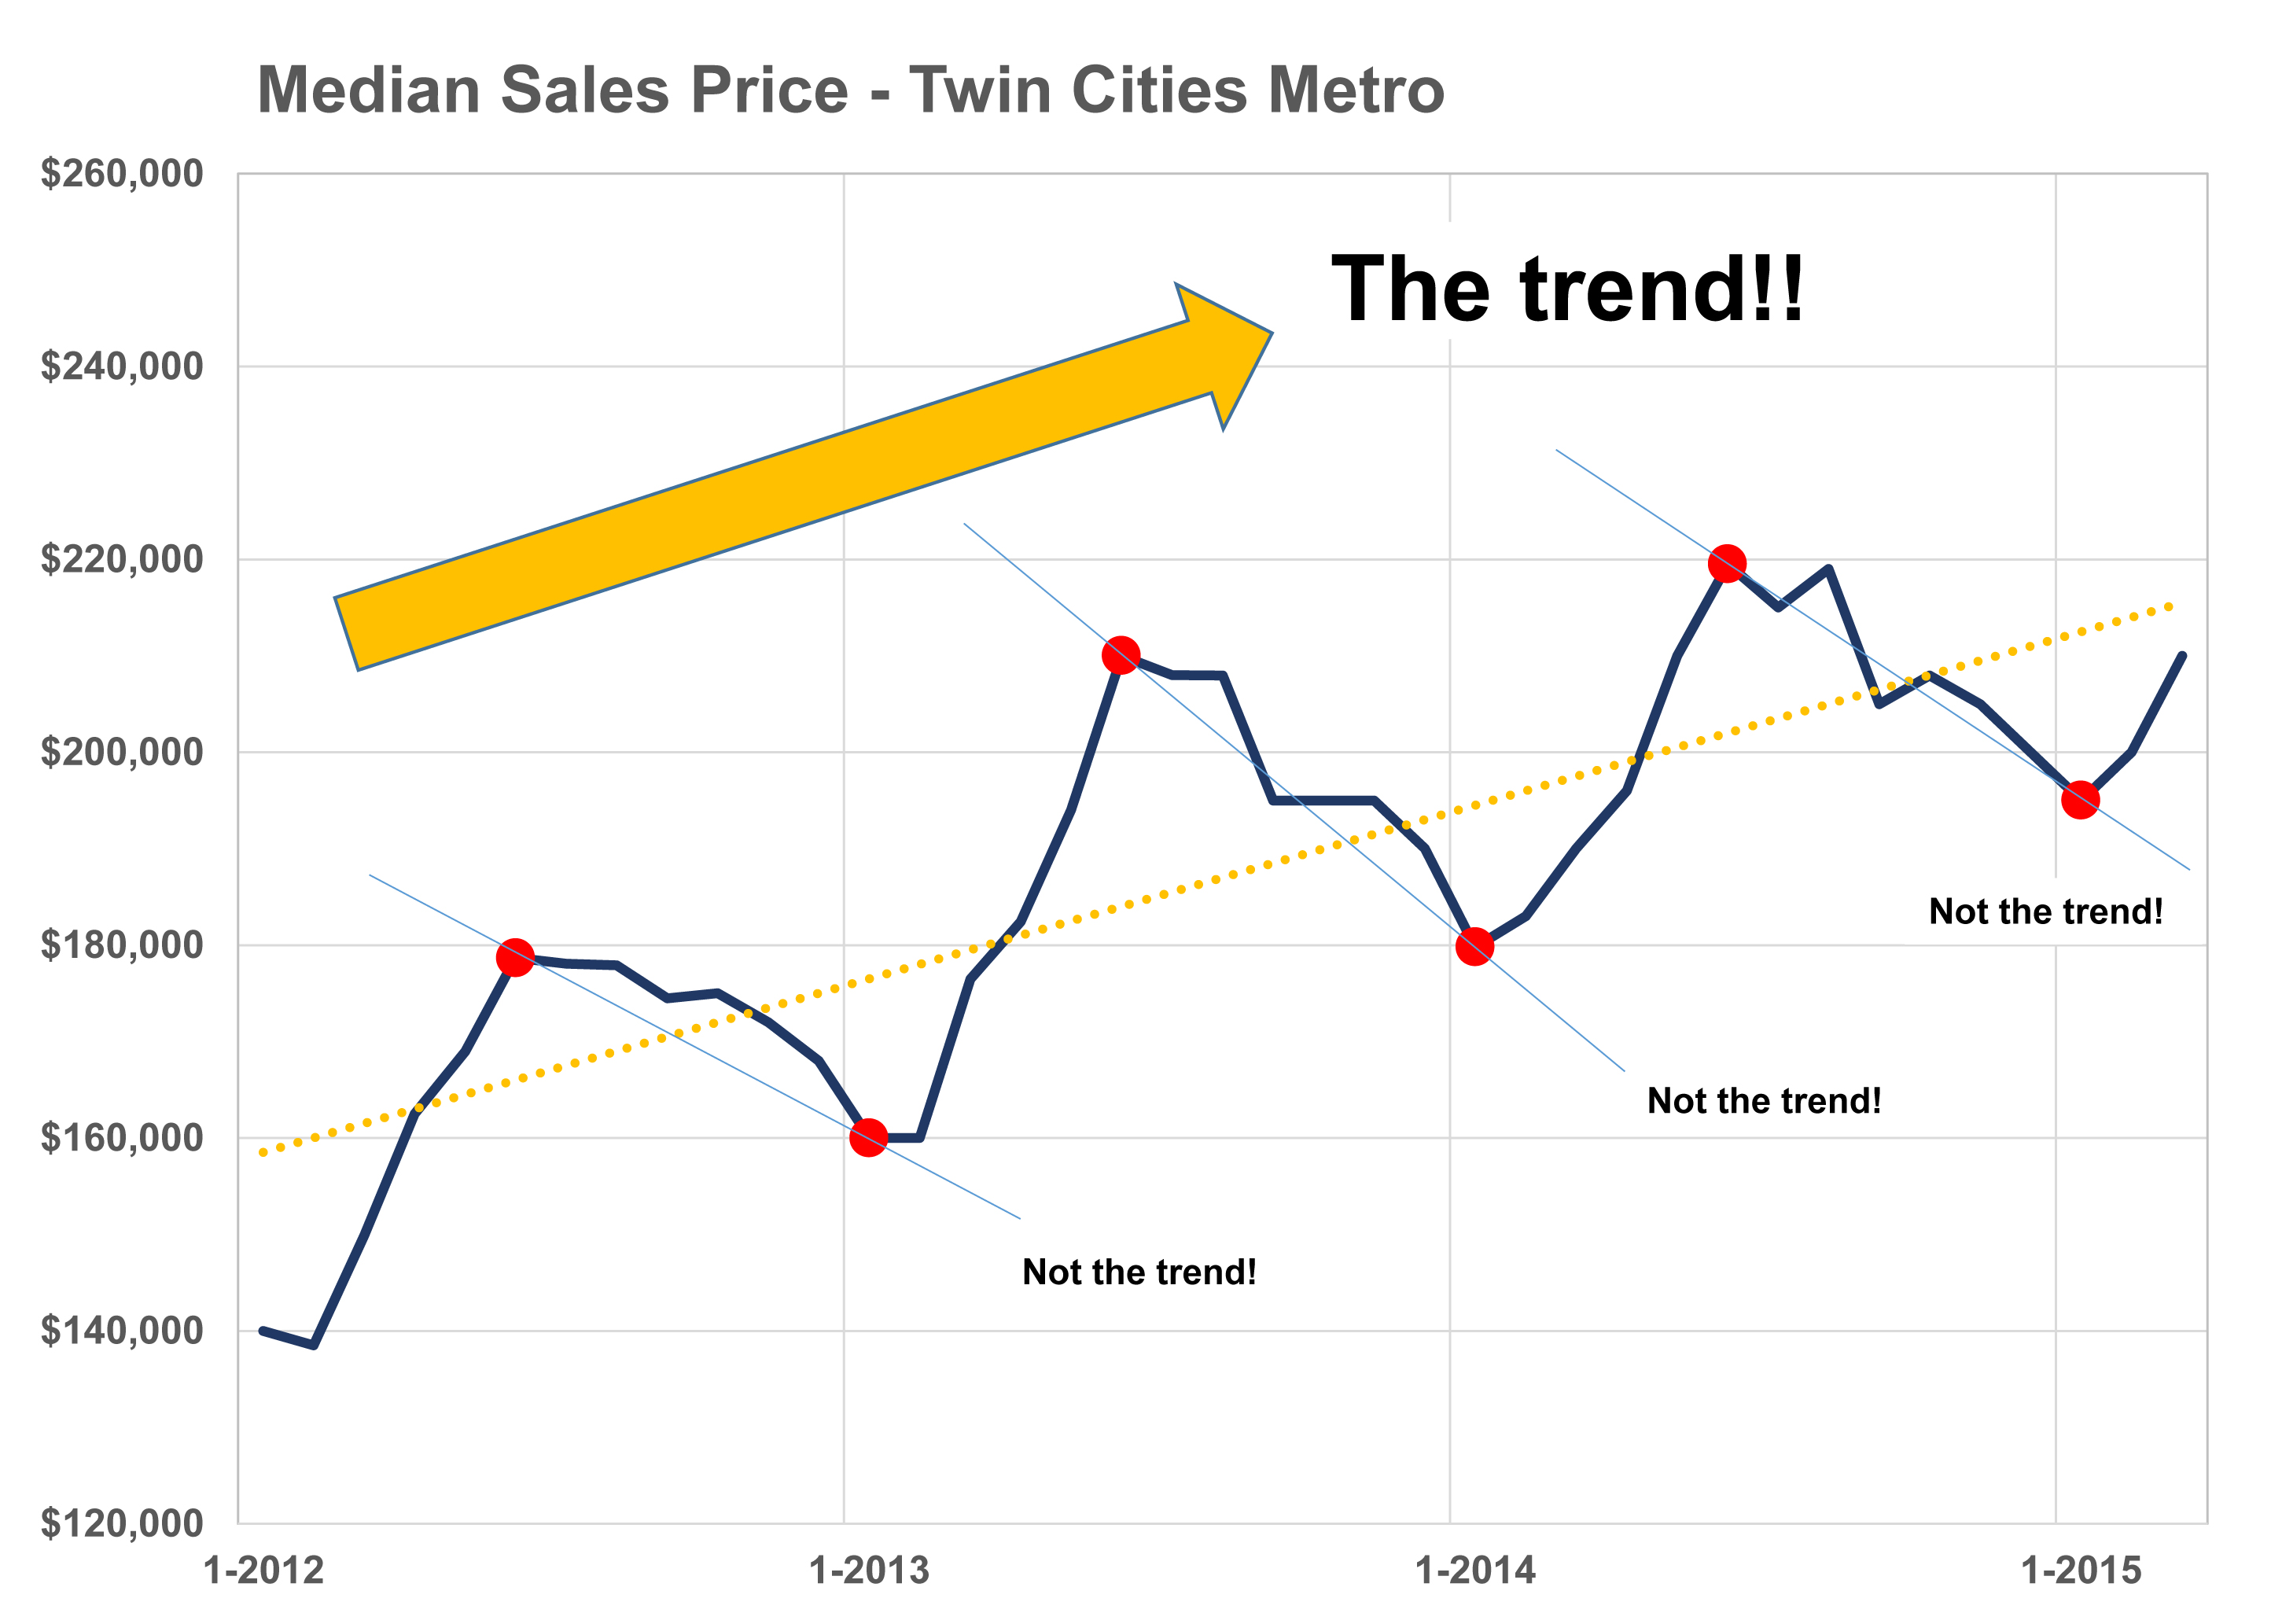
  • Median Sales Price increased 6.7% to $224,000
  • Days on Market decreased 5.0% to 76
  • Percent of Original List Price Received increased 0.7% to 97.5%
  • Months Supply of Inventory decreased 12.2% to 3.6

All comparisons are to 2014

Click here for the full Weekly Market Activity Report. From The Skinny Blog.

Posted in Weekly Report |
Thursday, June 4th, 2015
By David Arbit on Tuesday, June 2nd, 2015

“The trend is your friend.”

We don’t know who said it, or when. But we believe the spirit of that statement is to ignore the micro fluctuations in the data and focus on the overall, macro-level pattern. Let the trend speak to you. Ignore the noise in between. The noise is only there to confuse you. Actually, the noise is really there because buyer activity ebbs and flows with the freeze and thaw cycle as well as with the school year. Though it’s tempting to follow the seasonal peaks and valleys, it’s plain to see that prices and sales always decline between summer and fall, and then subside again between fall and winter. It’s as predictable as potholes in the Minnesota spring. As such, it’s less meaningful to compare June to October and far more meaningful to compare October of this year to October of last year. Because of this high degree of seasonality in our market, comparisons across all of our reporting environments utilize a year-over-year benchmark.

What-is-the-Trend
From The Skinny Blog.

Posted in The Skinny |
Monday, June 1st, 2015

For Week Ending May 23, 2015

The pattern has continued mostly unabated for the first part of the year thus far. In year-over-year comparisons, new listings have been up, sales have been up and inventory has been down. This was expected when the year began, and it has been a comfort to see this level of predictability. When something as important as a home purchase feels like a safe bet, the economy can continue to improve and prosperity is palpable.

In the Twin Cities region, for the week ending May 23:

  • New Listings increased 0.7% to 1,881
  • Pending Sales increased 18.6% to 1,500
  • Inventory decreased 4.0% to 16,078

For the month of April:

  • Median Sales Price increased 9.7% to $215,000
  • Days on Market decreased 4.5% to 85
  • Percent of Original List Price Received increased 1.1% to 97.0%
  • Months Supply of Inventory decreased 2.8% to 3.5

All comparisons are to 2014

Click here for the full Weekly Market Activity Report. From The Skinny Blog.

Posted in Weekly Report |
Tuesday, May 26th, 2015

Where has the Twin Cities real estate market been and where is it heading? This monthly summary provides an overview of current trends and projections for future activity.

Posted in Monthly Skinny Video |
Tuesday, May 26th, 2015

For Week Ending May 16, 2015

The song remains the same. While new listings and sales increase, inventory is not always able to keep pace. Demand is high as mortgage rates remain low. There are homes to choose from, for sure, but there should be more if balance is expected to be more than novelty. New construction is occurring, but the notable projects are just as liable to be rental as for sale. The dynamics of residential real estate are ever shifting, churning.

In the Twin Cities region, for the week ending May 16:

  • New Listings increased 7.4% to 2,187
  • Pending Sales increased 29.4% to 1,488
  • Inventory decreased 2.9% to 15,748

For the month of April:

  • Median Sales Price increased 9.7% to $215,000
  • Days on Market decreased 4.5% to 85
  • Percent of Original List Price Received increased 1.1% to 97.0%
  • Months Supply of Inventory decreased 2.8% to 3.5

All comparisons are to 2014

Click here for the full Weekly Market Activity Report. From The Skinny Blog.

Posted in Weekly Report |