Monday, August 7th, 2017
By David Arbit on Friday, August 4th, 2017

Given the fact that the school year is about a month away (yikes) and we’ve already had our first preview of fall weather, it feels like a good time to talk about seasonality. First of all, whatever you do, don’t use the term “seasonably adjusted.” Second of all, don’t make matters worse by talking about the “seasonably adjusted medium sales price.” That’s not a thing.

All kidding aside, both agents and the public have a vested interested in knowing how and when listings, inventory levels, purchase agreements and closed sales ebb and flow throughout the year. Ever been asked the question or wondered “when do the most new listings come on the market?” Or “when do buyers write the most offers?” Or how about “what month tends to have the greatest number of homes for sale?”

These are legitimate and important questions that can inform a variety of market-related strategies. Technically, April sees the highest volume of new listings, but buyers have the greatest number of choices in July. Signed purchase agreements peak in June along with closed sales. The shape of the seasonal curves can also be revealing. Seller activity tends to ramp up quickly in March and April and then quiet down rapidly starting in October. New listings are front-loaded in the first half of the year. Buyer activity, particularly pending sales, tends to follow more of a “normal” or even distribution throughout the year.
Seasonality-702x507
From The Skinny Blog.

Posted in The Skinny |
Monday, July 31st, 2017

For Week Ending July 22, 2017

Residential real estate activity has remained robust through the summer months so far. New listing and sales activity may not always land exactly where desired or expected from week to week, but it is clear by gradually increasing prices and ongoing low inventory that buyer demand has not weakened.

In the Twin Cities region, for the week ending July 22:

  • New Listings increased 0.9% to 1,842
  • Pending Sales decreased 6.3% to 1,297
  • Inventory decreased 17.2% to 12,555

For the month of June:

  • Median Sales Price increased 7.0% to $259,000
  • Days on Market decreased 16.1% to 47
  • Percent of Original List Price Received increased 0.8% to 99.5%
  • Months Supply of Inventory decreased 13.3% to 2.6

All comparisons are to 2016

Click here for the full Weekly Market Activity Report. From The Skinny Blog.

Posted in Weekly Report |
Monday, July 24th, 2017

For Week Ending July 15, 2017

The primary selling season tends to begin a subtle slowdown at this point in the year. That does not necessarily equate to less competition for available housing stock. While total sales and inventory may be lower than at points earlier in the year, those still looking for homes tend to match up with those willing to list. Call it a back-to-school effect or call it an active and healthy residential real estate market no matter the season.

In the Twin Cities region, for the week ending July 15:

  • New Listings increased 2.2% to 1,936
  • Pending Sales decreased 3.9% to 1,371
  • Inventory decreased 17.7% to 12,362

For the month of June:

  • Median Sales Price increased 7.0% to $259,000
  • Days on Market decreased 16.1% to 47
  • Percent of Original List Price Received increased 0.8% to 99.5%
  • Months Supply of Inventory decreased 16.7% to 2.5

All comparisons are to 2016

Click here for the full Weekly Market Activity Report. From The Skinny Blog.

Posted in Weekly Report |
Thursday, July 20th, 2017
By Erin Milburn on Tuesday, July 18th, 2017

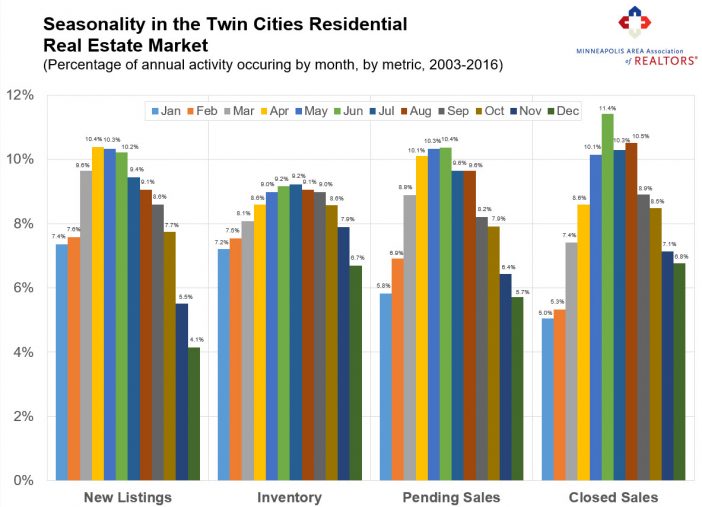
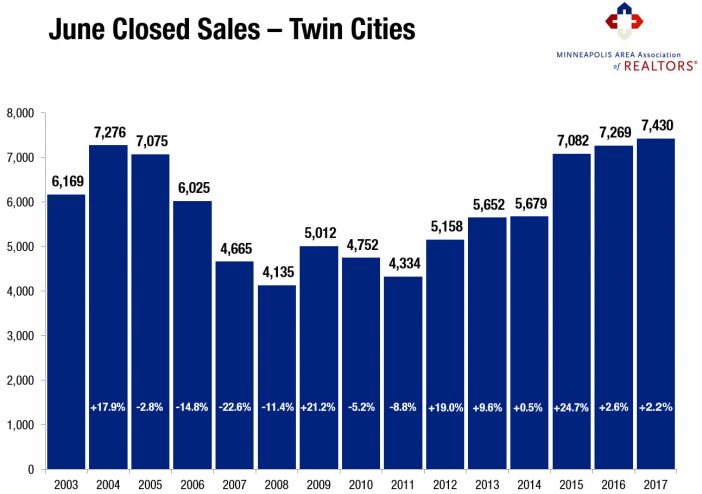
Despite the decelerating gains in buyer activity, June 2017 was a new record high for home sales in the Twin Cities. Compared to last June, closed sales in the metro rose 2.2 percent to reach a new high of 7,430 units. Meanwhile, pending sales only showed a 0.2 percent gain and new listings fell 0.5 percent. Persistently low inventory levels are keeping some would-be buyers out of the market. The number of homes for sale fell 16.5 percent to 12,464 active listings in the metro. Declining foreclosure and short sale activity can contribute to market-wide declines. For example, within the traditional segment, new listings rose 1.6 percent and pending sales rose 2.4 percent.

Prices are still marching higher. In fact, the median sales price rose 7.0 percent from last year to $259,000—a new record high. Home prices have now risen for the last 64 consecutive months. At 47 days on average, homes went under contract 16.1 percent faster than last June. However, half the homes that went under contract in June took less than 20 days to do so. The average percent of original list price received at sale was 99.5 percent, 0.8 percent higher than June 2016. Similarly, the median percent of original list price received at sale was 100.0 percent, meaning half the sales closed for over list price. The metro area has a sparse 2.5 months of housing supply—the lowest June reading since 2003. Generally, five to six months of supply is considered a balanced market where neither side has a clear advantage.

“The numbers confirm what agents already know about this market,” said Cotty Lowry, Minneapolis Area Association of REALTORS® (MAAR) President, “We are still very thirsty for listings. That means sellers who list well-presented, well-priced homes are being rewarded, and they’re finding the move-up market to be less competitive.”
June-2017-Chart-702x494
A thriving and diverse local economy has been conducive to housing recovery, as job growth is key to new household formations. The most recent national unemployment rate is 4.4 percent, though it’s 3.7 percent locally. The Minneapolis–St. Paul region has a resilient economy with a global reach, a talented workforce, top notch schools and a quality of life that’s enabled one of the highest homeownership rates in the country.

The average 30-year fixed mortgage rate has declined from 4.3 percent to 4.0 percent recently, still well below its long-term average of about 8.0 percent. Excluding any surprising data or events, the Federal Reserve is likely to increase their target federal funds rate at least once more this year. Wage and inventory growth are key to offsetting affordability declines brought on by higher rates and rising prices.

“Although supply is tight, attractive and competitively-priced homes remain in high demand,” said Kath Hammerseng, MAAR President-Elect. “But even as construction activity recovers somewhat, wage and housing supply growth remain key to balancing out affordability concerns.”
From The Skinny Blog.

Posted in The Skinny |
Monday, July 17th, 2017

For Week Ending July 8, 2017

From a heart-of-summer perspective, the residential real estate market has performed as expected when predictions were made at the front of the year. Buyer interest is high and inventory is not at a proper level to meet demand. Total sales and new listings are generally behind last year’s levels from week to week, but there is evidence of improvement in both metrics.

In the Twin Cities region, for the week ending July 8:

  • New Listings decreased 16.9% to 1,371
  • Pending Sales decreased 4.7% to 1,061
  • Inventory decreased 16.7% to 12,351

For the month of June:

  • Median Sales Price increased 7.0% to $259,000
  • Days on Market decreased 16.1% to 47
  • Percent of Original List Price Received increased 0.8% to 99.5%
  • Months Supply of Inventory decreased 16.7% to 2.5

All comparisons are to 2016

Click here for the full Weekly Market Activity Report. From The Skinny Blog.

Posted in Weekly Report |