Tuesday, May 29th, 2018

For Week Ending May 19, 2018

According to the National Association of REALTORS®, existing home sales were down 2.5 percent for the nation as a whole in April. While local trends do not necessarily coincide with national trends, a holistic outlook can often explain the general state of feelings regarding residential real estate. Sales have been lower in year-over-year comparisons in the hottest submarkets due to low inventory and a speed to sale that is faster than the market can replenish itself.

In the Twin Cities region, for the week ending May 19:

  • New Listings increased 8.9% to 2,279
  • Pending Sales decreased 10.2% to 1,437
  • Inventory decreased 22.6% to 9,768

For the month of April:

  • Median Sales Price increased 9.0% to $267,000
  • Days on Market decreased 10.2% to 53
  • Percent of Original List Price Received increased 0.8% to 99.9%
  • Months Supply of Inventory decreased 20.8% to 1.9

All comparisons are to 2017

Click here for the full Weekly Market Activity Report. From The Skinny Blog.

Posted in Weekly Report |
Thursday, May 24th, 2018
By David Arbit on Tuesday, May 22nd, 2018

Housing demand is strong and supply is low. That’s been the story for a few years. But there is some early evidence that things could be starting to loosen up. That said, buyers shopping this spring will still face stiff competition. The lack of inventory combined with rising prices is encouraging some sellers to stay put; however, the move up market offers a bit more inventory. This combined with historically low interest rates creates a perfect opportunity for homeowners looking to move up.

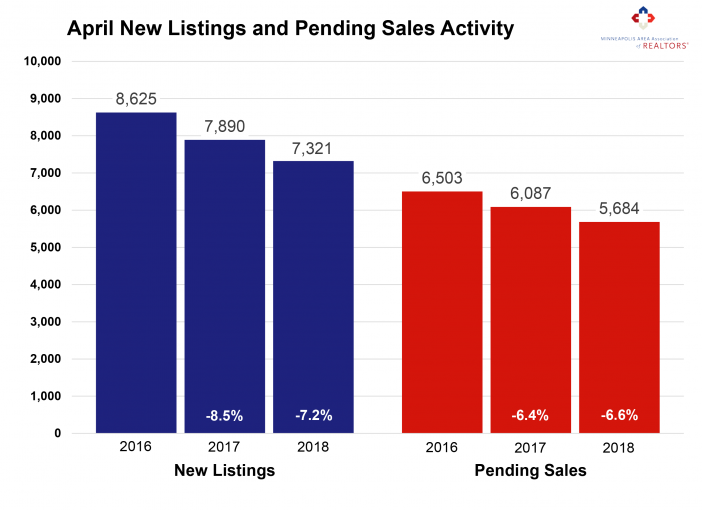
In April, sellers listed 7.2 percent fewer homes on the market—the sixth consecutive month of declines compared to a year ago. Largely due to the shortage, closed sales declined 5.2 percent compared to the prior year. For-sale housing inventory was 25.1 percent lower than April 2017. This shortage, which is particularly acute at the entry-level prices, has created a competitive environment where multiple offers and homes selling for over list price have become more common. Sellers are often receiving strong offers close to their original list price quickly, which can sometimes frustrate home buyers.

New construction closed sales rose 13.2 percent compared to last April. Although single family homes made up about 73.0 percent of all sales, townhomes and condos have seen stronger demand lately. Similarly, previously-owned homes made up about 90.0 percent of sales, but new construction showed a much stronger increase in pending and closed purchase activity. The average time on market is still 53 days, reminding sellers that they still need to stage and price their homes well.

April 2018 by the Numbers (compared to a year ago)
• Sellers listed 7,321 properties on the market, a 7.2 percent decrease
• Buyers closed on 4,635 homes, a 5.2 percent decrease
• Inventory levels for April fell 25.1 percent compared to 2017 to 8,958 units
• Months Supply of Inventory was down 25.0 percent to 1.8 months
• The Median Sales Price rose 8.6 percent to $266,000, a record high for April
• Cumulative Days on Market declined 10.2 percent to 53 days, on average (median of 18)
• Changes in Sales activity varied by market segment

Single family sales declined 6.4 percent; condo sales rose 3.0 percent; townhome sales rose 1.0 percent
Traditional sales fell 2.8 percent; foreclosure sales decreased 43.3 percent; short sales fell 20.0 percent
Previously-owned sales fell 5.6 percent; new construction sales rose 13.2 percent

From The Skinny Blog.

Posted in The Skinny |
Monday, May 21st, 2018

For Week Ending May 12, 2018

Inventory and days on market both continue to skim along at historic lows, while buyer demand is creating competitive purchase offer situations that are increasing the number of homes sold for more than the asking price. This practice is nothing new in more popular areas, but higher offers are becoming normal outside of the hottest cities and neighborhoods. Affordability is a challenge for some potential buyers, yet prices still rise in an environment of economic confidence.

In the Twin Cities region, for the week ending May 12:

  • New Listings decreased at 2,073
  • Pending Sales decreased 5.5% to 1,466
  • Inventory decreased 23.9% to 9,446

For the month of April:

  • Median Sales Price increased 8.9% to $266,750
  • Days on Market decreased 10.2% to 53
  • Percent of Original List Price Received increased 0.7% to 99.8%
  • Months Supply of Inventory decreased 20.8% to 1.9

All comparisons are to 2017

Click here for the full Weekly Market Activity Report. From The Skinny Blog.

Posted in Weekly Report |
Monday, May 14th, 2018

For Week Ending May 5, 2018

Year-over-year percentage changes for housing metrics like inventory, median sales price and days on market have sometimes looked dramatic over the past few years in most markets across the country not named Houston. But as faster sales and higher prices persist, another trend is beginning to emerge: reliability. Although more market balance is preferred, the current situation has proven to be surprisingly sustainable, at least for the time being.

In the Twin Cities region, for the week ending May 5:

  • New Listings decreased 13.9% to 2,054
  • Pending Sales decreased 10.0% to 1,456
  • Inventory decreased 23.2% to 9,155

For the month of March:

  • Median Sales Price increased 9.8% to $258,050
  • Days on Market decreased 21.9% to 57
  • Percent of Original List Price Received increased 1.1% to 99.1%
  • Months Supply of Inventory decreased 22.7% to 1.7

All comparisons are to 2017

Click here for the full Weekly Market Activity Report. From The Skinny Blog.

Posted in Weekly Report |
Monday, May 7th, 2018

For Week Ending April 28, 2018

As with last spring, the home-purchasing season will be competitive this year. Demand is still strong, especially in light of rising mortgage rates. Savvy consumers will want to get into a home before rates go up again. Amidst an environment of low inventory, buyers need to remain watchful of new listings and make their offers quickly.

In the Twin Cities region, for the week ending April 28:

  • New Listings decreased 7.2% to 1,761
  • Pending Sales decreased 9.5% to 1,389
  • Inventory decreased 23.5% to 9,051

For the month of March:

  • Median Sales Price increased 9.8% to $258,000
  • Days on Market decreased 21.9% to 57
  • Percent of Original List Price Received increased 1.1% to 99.1%
  • Months Supply of Inventory decreased 22.7% to 1.7

All comparisons are to 2017

Click here for the full Weekly Market Activity Report. From The Skinny Blog.

Posted in Weekly Report |