Monday, July 9th, 2018

For Week Ending June 30, 2018

The unemployment rate rose to 4.0 percent in June 2018, marking the first increase in nearly a year. Economic forecasters are calling this a healthy increase indicative of more people being counted as entering the work force in an exceptional job market that added more than 213,000 paying jobs in June. Strong demand for workers combined with low supply creates upward pressure on wages. Employed people with higher wages are generally good for residential real estate.

In the Twin Cities region, for the week ending June 30:

  • New Listings increased 15.1% to 1,864
  • Pending Sales increased 1.1% to 1,519
  • Inventory decreased 16.5% to 11,374

For the month of May:

  • Median Sales Price increased 8.3% to $270,750
  • Days on Market decreased 9.6% to 47
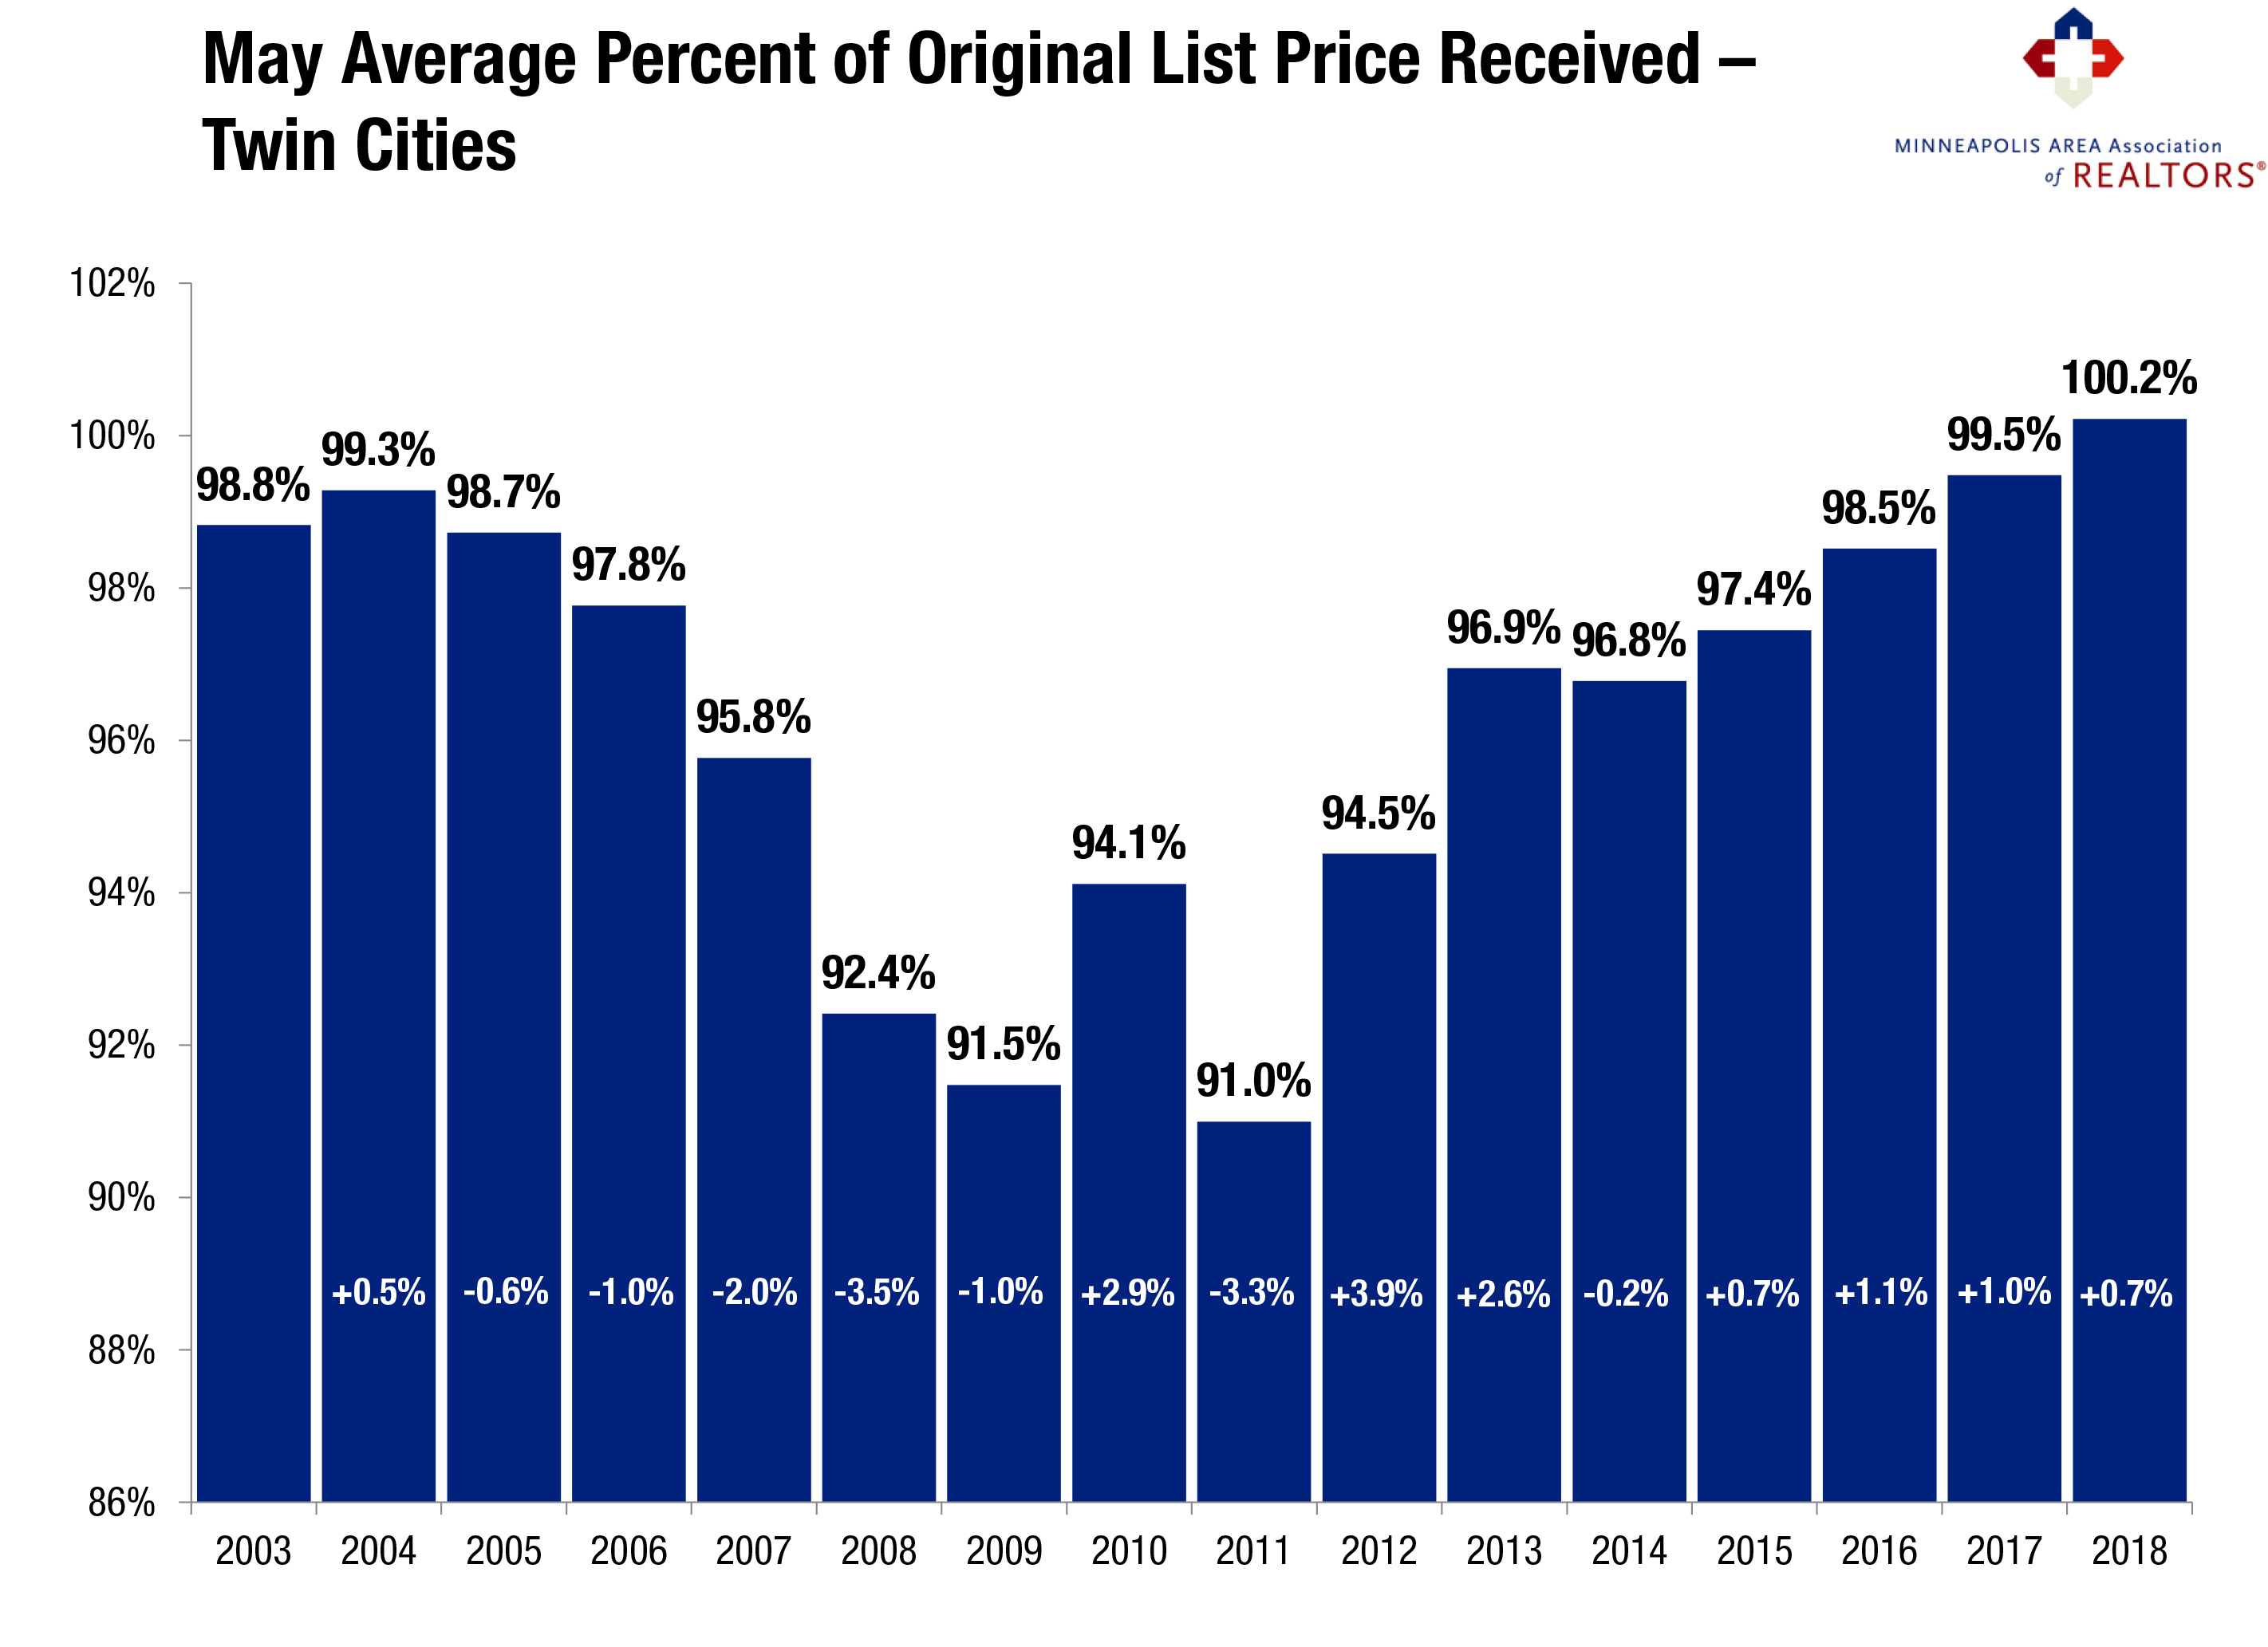
  • Percent of Original List Price Received increased 0.7% to 100.2%
  • Months Supply of Inventory decreased 12.0% to 2.2

All comparisons are to 2017

Click here for the full Weekly Market Activity Report. From The Skinny Blog.

Posted in Weekly Report |
Monday, July 2nd, 2018

For Week Ending June 23, 2018

The first half of the year in residential real estate fared as expected, with the most obvious markers continuing to be low inventory and higher prices. We are also seeing decreased affordability in many markets coupled with more urgency (lower days on market) and increased purchase offers (higher pending sales) ahead of perceived future rate increases that have not yet materialized in the wake of the 0.25 percent increase in the federal funds rate. All of this makes for a busy summer. Let’s examine the local market.

In the Twin Cities region, for the week ending June 23:

  • New Listings increased 1.3% to 1,987
  • Pending Sales decreased 3.7% to 1,437
  • Inventory decreased 16.8% to 11,171

For the month of May:

  • Median Sales Price increased 8.4% to $271,000
  • Days on Market decreased 9.6% to 47
  • Percent of Original List Price Received increased 0.7% to 100.2%
  • Months Supply of Inventory decreased 12.0% to 2.2

All comparisons are to 2017

Click here for the full Weekly Market Activity Report. From The Skinny Blog.

Posted in Weekly Report |
Monday, June 25th, 2018

For Week Ending June 16, 2018

Sales across the nation have risen not only because this time of year typically offers an increase in residential real estate activity, but because this year in particular has proven to have strong economic and market conditions. While it’s still true that prices are rising and inventory is tightening, these long-standing trends have been happening gradually enough to not deter those who are serious about becoming homeowners.

In the Twin Cities region, for the week ending June 16:

  • New Listings increased 10.1% to 2,057
  • Pending Sales decreased 4.3% to 1,420
  • Inventory decreased 18.0% to 10,898

For the month of May:

  • Median Sales Price increased 8.4% to $271,000
  • Days on Market decreased 9.6% to 47
  • Percent of Original List Price Received increased 0.7% to 100.2%
  • Months Supply of Inventory decreased 12.0% to 2.2

All comparisons are to 2017

Click here for the full Weekly Market Activity Report. From The Skinny Blog.

Posted in Weekly Report |
Monday, June 25th, 2018

“Buyers need to remain watchful of new listings and make their offers quickly.”

Posted in Monthly Skinny Video |
Monday, June 18th, 2018
By David Arbit on Monday, June 18th, 2018

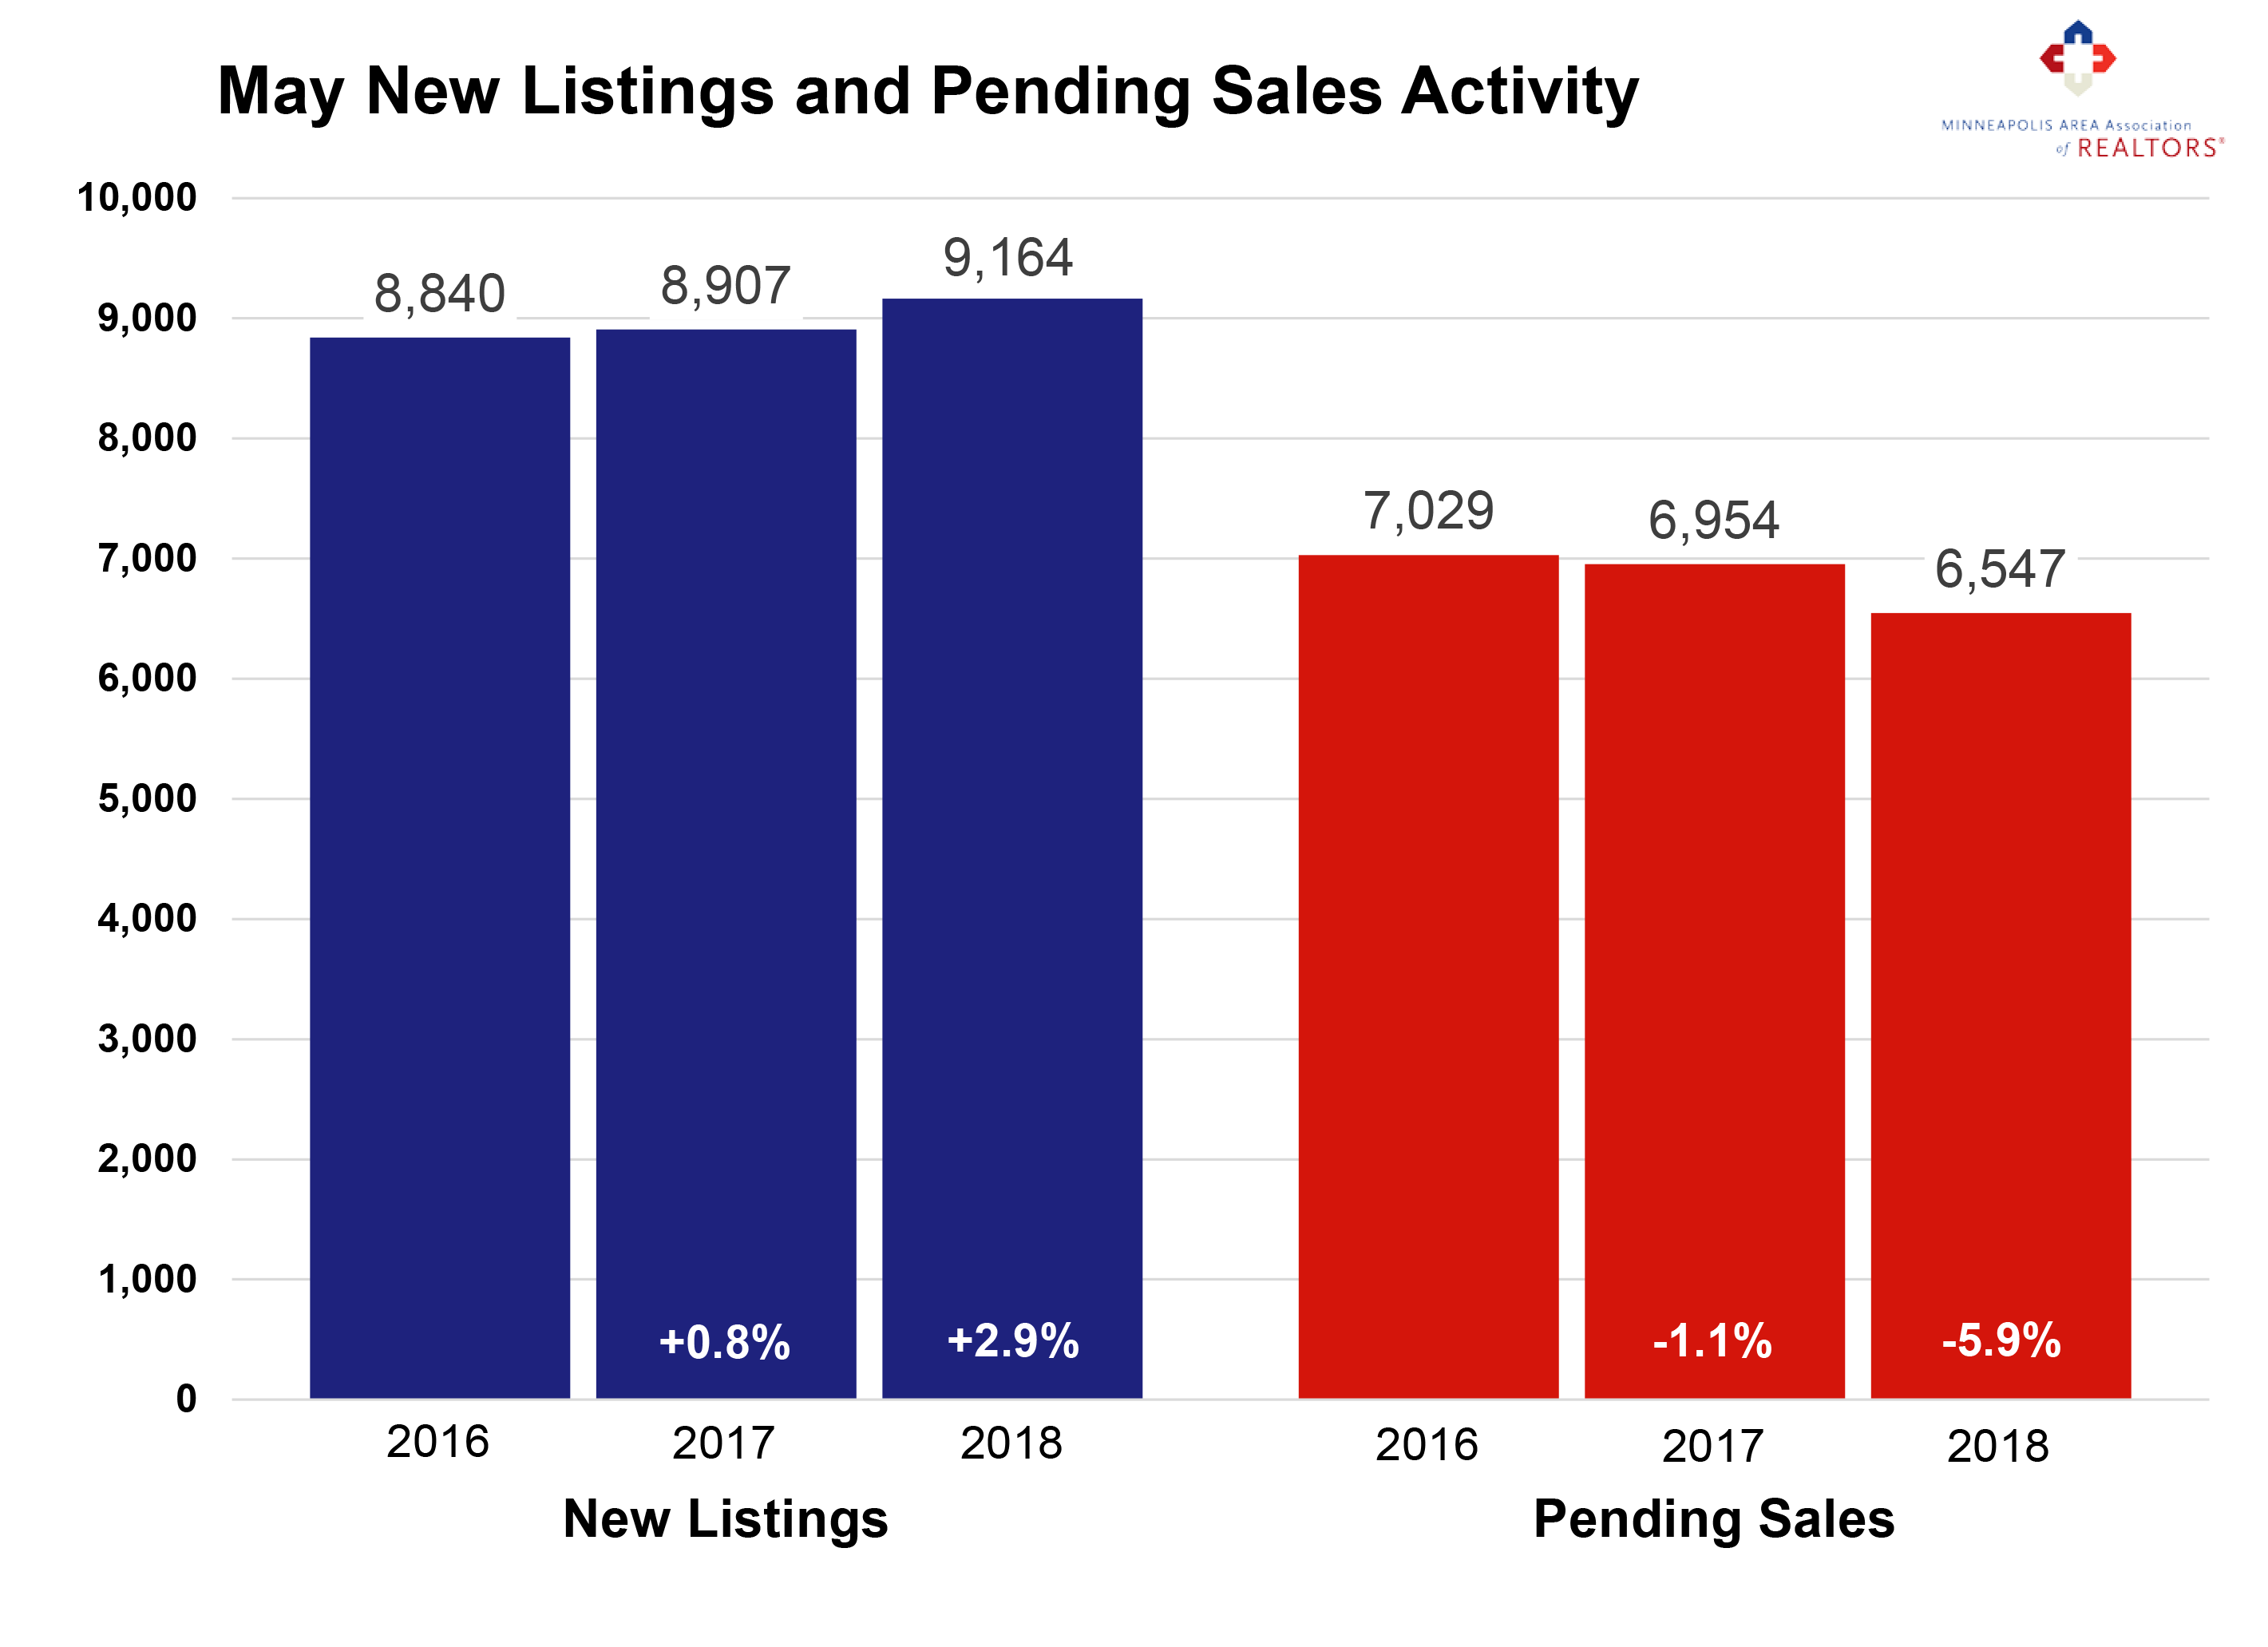
More sellers may finally be jumping into the market at a time when buyers are facing the challenges of low inventory. Since 2013, new listing activity has been subdued relative to buyer activity and hasn’t surpassed 9,000 new listings per month since 2010. Excluding 2010, we haven’t had this many new listings for any month since May 2008. Increasing seller activity and tapering demand are consistent with a marketplace that’s starting to loosen up just a bit. That said, buyers shopping this spring and summer will still face stiff competition. Being successful in this market takes commitment, decisiveness and persistence—traits not necessarily typical of every buyer. In fact, May marked the sixth consecutive month of year-over-year declines in closed sales, likely reflecting the lack of homes for sale and not weakness in the economy. Strong demand combined with low supply means sellers yielded an average of 100.2 percent of their list price in May, a record high for any month and the first time this indicator has exceeded 100.0 percent. The shortage is especially noticeable at the entry-level prices, where multiple offers and homes selling for over list price have become increasingly common. Homes continue to sell quickly and for close to or above list price in this tight market, but nearly 12,000 buyers and sellers managed to transact real property last month.
May 2018 by the Numbers (compared to a year ago)

Sellers listed 9,164 properties on the market, a 2.9 percent increase
Buyers closed on 5,739 homes, a 11.3 percent decrease
Inventory levels for May fell 17.8 percent compared to 2017 to 10,403 units
Months Supply of Inventory was down 16.0 percent to 2.1 months
The Median Sales Price rose 8.4 percent to $271,000, a record high
Cumulative Days on Market declined 9.6 percent to 47 days, on average (median of 17)
Changes in Sales activity varied by market segment

Single family sales sank 12.3 percent; condo sales fell 3.5 percent; townhome sales declined 7.5 percent
Traditional sales fell 9.7 percent; foreclosure sales sank 38.1 percent; short sales plummeted 59.7 percent
Previously-owned sales fell 12.4 percent; new construction sales rose 11.1 percent
From The Skinny Blog.

Posted in The Skinny |