Monday, November 25th, 2013

This week, and through the end of the year, you might be watching for much-needed inventory gains that will not arrive due to traditional end-of-year lulls in the marketplace related to holidays and/or colder weather. Nobody wants to sell at the bottom. In general, inventory pools are up in year-over-year comparisons in many areas, suggestive of seller confidence with recent price gains. Overall recovery is unlikely to stall. The pace of price gains and bidding wars may ease, but that’s not necessarily a bad thing. Just ask any prospective home buyer.

In the Twin Cities region, for the week ending November 16:

  • New Listings decreased 4.2% to 1,003
  • Pending Sales decreased 7.3% to 758
  • Inventory decreased 3.2% to 15,318

For the month of October:

  • Median Sales Price increased 11.4% to $194,900
  • Days on Market decreased 27.2% to 75
  • Percent of Original List Price Received increased 1.4% to 95.8%
  • Months Supply of Inventory decreased 12.5% to 3.5

All comparisons are to 2012

Click here for the full Weekly Market Activity Report.From The Skinny.

Posted in Weekly Report |
Monday, November 18th, 2013

Fewer people are out scouting homes now that they’re scouting the perfect bird for their Thanksgiving feast. Weekly and monthly seller and buyer activity may be slowing in comparison to last reporting period, but overall markets still show signs of stable recovery. By and large, expect the end of 2013 to look just as juicy and golden as your bird is soon to be.

In the Twin Cities region, for the week ending November 9:

  • New Listings increased 11.4% to 1,132
  • Pending Sales decreased 3.1% to 819
  • Inventory decreased 3.2% to 15,517

For the month of October:

  • Median Sales Price increased 11.4% to $195,000
  • Days on Market decreased 27.2% to 75
  • Percent of Original List Price Received increased 1.4% to 95.8%
  • Months Supply of Inventory decreased 12.5% to 3.5

All comparisons are to 2012

Click here for the full Weekly Market Activity Report.From The Skinny.

Posted in Weekly Report |
Tuesday, November 12th, 2013
6a00e54ee9620b8834019b00fc7317970c-800wiMinneapolis, Minnesota (November 12, 2013) – The Minneapolis-St. Paul metropolitan housing market continued along the path toward recovery in October. While some measures suggest a slowing in the pace of recovery, this
deceleration is primarily the result of a healing distressed segment. Sellers felt more confident as new listings rose 15.1 percent to 6,102, marking the seventh consecutive year-over-year increase in monthly seller activity. Buyers
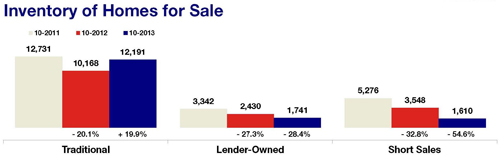
closed on 4,495 homes, a modest 1.9 percent increase over last October. Consumers have 15,556 properties from which to choose – or just 3.7 percent fewer than last October, but 19.2 percent more than in January 2013.

The market-wide median sales price was unchanged from September 2013 at $195,000, but was up 11.4 percent compared to October 2012. In October 2011, foreclosures and short sales together comprised 46.2 percent of all closed
sales. In October 2013, these two segments made up only 21.5 percent of all sales. For new listings, the same October figure dropped from 42.4 percent in 2011 to 19.5 percent of all new listings in 2013.

“The slight decrease in pending sales activity is entirely attributable to declines in the number of contracts signed on foreclosure and short sale properties,” said Andy Fazendin, President of the Minneapolis Area Association
of REALTORS® (MAAR).

Traditional pending sales activity was up 19.7 percent while foreclosure and short sale contracts were down about 33.7 and 50.8 percent, respectively. Closed sales increased 1.9 percent overall, but traditional closed sales rose 23.6
percent. Foreclosure sales and short sales were down 32.9 and 50.0 percent, respectively. New listings rose 15.1 percent overall, but traditional seller activity increased 39.0 percent higher as foreclosure and short sale new
listings fell 24.4 and 50.1 percent, respectively.

On average, homes are spending 75 days on the market – the quickest October pace in seven years. Sellers are receiving an average of 95.8 percent of their original list price – the highest October ratio since 2006. The Twin Cities
metro now has 3.5 months’ supply of inventory, which suggests sellers are regaining their leverage.

“We are within the final phases of market recovery,” said Emily Green, MAAR President-Elect. “Supply levels are stabilizing and regenerating, which means buyers have more choices and balance is being restored.”

All information is according to the Minneapolis Area Association of REALTORS® (MAAR) based on data from NorthstarMLS. MAAR is the leading regional advocate and provider of information services and research on the real estate industry for brokers, real estate professionals and the public. MAAR serves the Twin Cities 13-county metro area and western Wisconsin. 10K Research and Marketing, LLC is a wholly owned subsidiary of MAAR.

Posted in The Skinny |
Monday, November 11th, 2013

Most analysts agree that we are not in the midst of inflating another housing bubble. Instead, we are sometimes seeing seemingly dramatic price and sales increases, but off of artificially low baseline levels. Private equity firms and first-time buyers have bought up a lot of inventory, while some sellers await further price recovery. Credit remains available but not abundant, so lenders are avoiding the facilitation of another bubble. Default rates and foreclosure activity are at multiyear lows. As of now, the housing recovery is intact.

In the Twin Cities region, for the week ending November 2:

  • New Listings increased 5.5% to 1,185
  • Pending Sales increased 6.9% to 972
  • Inventory decreased 2.6% to 16,034

For the month of October:

  • Median Sales Price increased 11.4% to $195,000
  • Days on Market decreased 27.2% to 75
  • Percent of Original List Price Received increased 1.4% to 95.8%
  • Months Supply of Inventory decreased 12.5% to 3.5

All comparisons are to 2012

Click here for the full Weekly Market Activity Report.From The Skinny.

Posted in Weekly Report |
Monday, November 4th, 2013

Holiday decorations have debuted in department stores across the nation (really?), and their mere presence just might affect housing activity for those prone to a good winter hunker. Comparisons to year-ago levels will show improvement and recovery, even as general activity will likely slow through the rest of 2013. With rates seemingly in a continuous go-low zone, the thrifty buyer and willing seller will still meet for transactional tea.

In the Twin Cities region, for the week ending October 26:

  • New Listings increased 16.4% to 1,209
  • Pending Sales increased 10.4% to 974
  • Inventory decreased 3.1% to 16,211

For the month of September:

  • Median Sales Price increased 11.7% to $195,000
  • Days on Market decreased 29.7% to 71
  • Percent of Original List Price Received increased 1.7% to 96.4%
  • Months Supply of Inventory decreased 14.0% to 3.7

All comparisons are to 2012

Click here for the full Weekly Market Activity Report.From The Skinny.

Posted in Weekly Report |